According to the U.S. Census' 2002-2003 population surveys, 24.1% of U.S. blacks live in poverty. The corresponding number for non-Hispanic whites is 8%, while that for Hispanics is 21.8%. These numbers and the inequalities they represent are troubling, but it is some consolation to see that official data show an overall decline in the poverty rate among these groups since 1994. Because the Census racial and ethnic categories were redefined in 2002, no direct comparison can be made between 2002 and previous years. However, from 1994 to 2001, the poverty rate among blacks decreased from 30.6% to 22.7%, and from 30.7% to 21.4% for those of Hispanic origin.
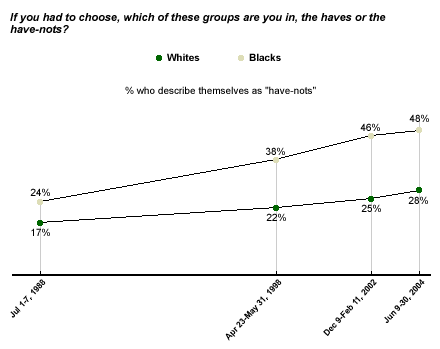
Generally speaking, Americans tend to be more pessimistic about their economic situations than the improving poverty data would imply, and the public's view of its financial situation has not improved as the poverty level has declined. According to Gallup's June 2004 Minority Rights and Relations poll*, 48% of blacks and 28% of whites describe themselves as the "have-nots" of American society. Both percentages -- especially that among blacks -- are significantly higher than when the question was initially asked 16 years ago.
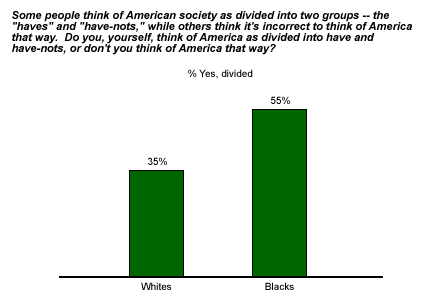
A Society Divided
Gallup first asked Americans if they feel America is divided into "haves" and "have-nots," then asked them which category they would put themselves in if they had to choose. Blacks, more than any other race, think of America as starkly divided; nearly 3 in 5 blacks (55%) are of this opinion, compared with 35% of whites and 31% of Hispanics. Interestingly, more whites and blacks perceive this division today than was the case when Gallup first asked the question in 1988; that year, 24% of whites and 49% of blacks said they saw a divided America.
The "Have-Nots"
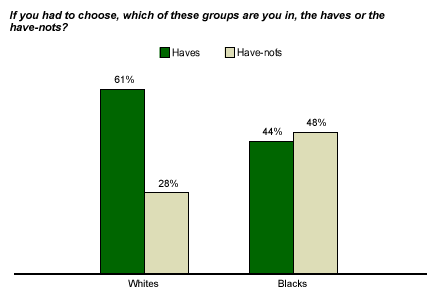
As the data clearly suggest, poverty is not a prerequisite to thinking of oneself as a "have-not." The percentages of Americans in each group that define themselves as have-nots are at least twice the percentages of each group who live below the official poverty line. Current Census data designate 8% of non-Hispanic whites as living in poverty, while the Gallup survey indicates that 26% of non-Hispanic whites think of themselves as have-nots. Twenty-four percent of blacks and 22% of Hispanics are classified as living in poverty, but about twice as many put themselves in the have-not category.
Even as the official poverty rate among whites and blacks has inched downward in recent years, members of both groups have tended to see themselves more as have-nots now than they did in the late 1980s. Just under a quarter (24%) of blacks said that they were "have-nots" in 1988, and 16 years later, that number has swelled to 48%. In 2004, 28% of whites describe themselves as "have-nots," compared with 17% in 1988.
Bottom Line
Given that the poverty rate in America has declined, it is surprising that more Americans are identifying themselves as have-nots. Though the concept of relative poverty could explain some part of this paradox, it is still puzzling. The numbers bring to mind the recent book, The Progress Paradox, How Life Gets Better While People Feel Worse, in which New Republic Editor Gregg Easterbrook argues that life in the developed world is better than ever on almost every tangible indicator, even though naysayers would like us to believe otherwise.
Finally, another paradox: Considering the official poverty rates, blacks are proportionally more optimistic about their economic situations than whites are. Even though only 8% of whites live in poverty, more than three times that number say they are have-nots. For blacks, only about double the number of those in poverty call themselves have-nots.
*Results are based on telephone interviews with 2,250 national adults, aged 18 and older, conducted June 9-30, 2004, including oversamples of blacks and Hispanics that are weighted to reflect their proportions in the general population. For results based on the total sample of national adults, one can say with 95% confidence that the maximum margin of sampling error is ±5 percentage points.
Results for the sample of 816 non-Hispanic whites, aged 18 and older, are based on telephone interviews conducted June 9-30, 2004. For results based on the total sample, one can say with 95% confidence that the margin of sampling error is ±6 percentage points.
Results for the sample of 801 blacks, aged 18 and older, are based on telephone interviews conducted June 9-30, 2004. For results based on the total sample, one can say with 95% confidence that the margin of sampling error is ±8 percentage points.
Results for the sample of 503 Hispanics, aged 18 and older, are based on telephone interviews, conducted June 9-30, 2004. For results based on the total sample, one can say with 95% confidence that the margin of sampling error is ±8 percentage points. (164 out of the 503 interviews with Hispanics were conducted in Spanish.)