WASHINGTON, D.C. -- Close to half of adults (46.1%) living in McAllen-Edinburg-Mission, Texas, had no healthcare coverage last year -- nearly three times the national average -- and the highest percentage across the 188 U.S. metropolitan areas that Gallup and Healthways surveyed. Texas and California account for 9 of the 10 metro areas with the highest rates of uninsured residents. The four metro areas with the lowest rates of uninsured were in Massachusetts, each with about 1 in 20 adults lacking coverage.
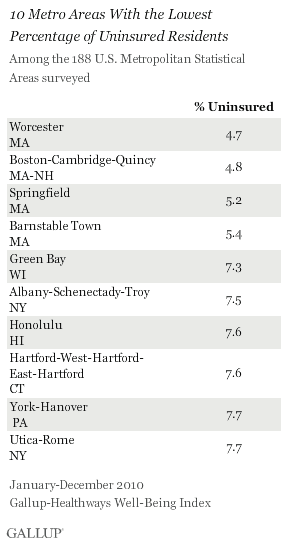
These metro area findings are consistent with Gallup-Healthways Well-Being Index 2010 state-level data, which show the uninsured rate is highest in Texas and lowest in Massachusetts, where state law requires almost all adults to carry health insurance.
The 2010 metro area findings are extracted from Gallup's 2010 Daily tracking data set and are based on more than 200,000 U.S. adults, aged 18 and older, who live in one of the nation's larger metro areas. Gallup categorizes U.S. metro areas according to the U.S. Office of Management and Budget's definitions for Metropolitan Statistical Areas (MSAs), and reports on all MSAs for which there are a minimum of 300 interviews available. In 2010, 188 MSAs met this criterion.
Uninsured Rates Highest in Largely Hispanic Metro Areas
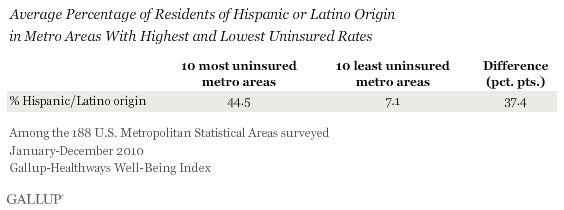
The 10 metro areas with the highest uninsured rates have a significantly higher Hispanic population than the 10 metro areas with the lowest percentage of uninsured adults. On average, 44.5% of residents surveyed in the 10 metro areas with the highest rates of uninsured are of Hispanic or Latino origin according to U.S. Census Bureau data from 2009. This compares with an average of 7.1% in the 10 metro areas with the lowest percentage of uninsured residents.
In McAllen-Edinburg-Mission, where nearly half the population is uninsured, 89.8% of residents are Hispanic. The 46.1% who were uninsured in that metro area is close to the national average of 38.9% of Hispanics who were uninsured in 2010.
Gallup also found that low-income Americans are among the most likely to be uninsured, which explains, in part, the high rate of uninsured among Hispanics, who, in general, have lower than average incomes. Hispanics at every income level, however, are more likely than non-Hispanics to be uninsured.
But not all metro areas in the top 10 uninsured group have a high Hispanic population. One exception is Myrtle Beach-North Myrtle Beach-Conway, S.C., where 28.9% are uninsured, but 5% of the population is Hispanic. Additionally, more than 20% of U.S. adults were uninsured in 56 of the 188 U.S. metro areas Gallup and Healthways surveyed, representing 21 different states, clearly demonstrating that high rates of uninsured exist in all types of communities.
Money for and Access to Care Bigger Issue for Metro Areas With High Uninsured Rates
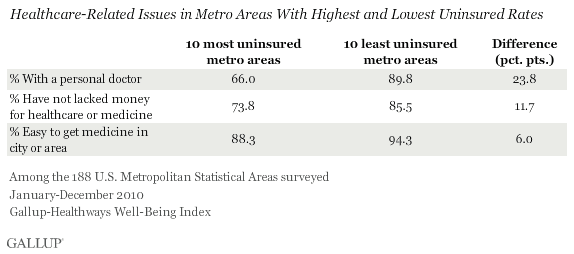
Americans living in the 10 metro areas with the highest rate of uninsured residents are about 25% less likely than those living in the 10 metro areas with the lowest rate of uninsured to have a personal doctor.
Residents living in the 10 metros with the highest uninsured rates are also less likely than those living in metro areas with the lowest uninsured rates to say there was no time in the past year when they failed to receive medical care because of the cost, 73.8% vs. 85.5%. This difference in being able to afford care is relatively small though, considering the significant difference in health coverage rates between these two groups of metros.
Adults in the 10 metro areas with the highest rate of uninsured are slightly less likely to say they have easy access to medicine where they live, although nearly 9 in 10 say they do.
Bottom Line
As the new healthcare law reaches the one-year mark, Gallup-Healthways Well-Being Index data continue to find significant differences in coverage across the United States. There has also been no change, so far, in the percentage of uninsured adults at the national level, with 16.3% lacking healthcare in February of this year. The government, however, has only implemented certain parts of the law since it passage in March 2010 -- the bulk of the legislation, including the individual mandate, does not go into effect until 2014.
Although the Obama administration continues to implement the law on course, it faces ongoing legal and political challenges from the states and Republican lawmakers. And a year later, the law still lacks strong public backing. Americans remain divided in their support for the law, and more people believe the new healthcare reform law will worsen rather than improve medical care in the United States.
Learn more about the Gallup-Healthways Well-Being Index.
Survey Methods
Results are based on telephone interviews conducted as part of the Gallup-Healthways Well-Being Index survey Jan. 2-Dec. 29, 2010, with a random sample of 245,817 adults, aged 18 and older, living in reportable metropolitan statistical areas in all 50 U.S. states and the District of Columbia, selected using random-digit-dial sampling.
Metro areas in this article are based on the Metropolitan Statistical Areas (MSAs) as defined by the U.S. Office of Management and Budget. In many cases, more than one city is included in the same MSA. The San Jose metropolitan statistical area, for example, also includes the smaller nearby cities of Sunnyvale and Santa Clara in addition to San Jose, Calif., itself. Each respondent is attributed to his or her MSA based on the self-report of his or her ZIP code Gallup reports data for metropolitan statistical areas for which there were at least 300 completed interviews in 2010. A total of 188 MSAs met this criterion, which generally incorporates the larger MSAs according to population size.
Maximum expected error ranges for the MSAs vary according to size, ranging from less than 1 percentage point for the largest cities represented to ±6.5% for the smallest. Interviews are conducted with respondents on landline telephones (for respondents with a landline telephone) and cellular phones (for respondents who are cell phone only and cell phone mostly).
In addition to sampling error, question wording and practical difficulties in conducting surveys can introduce error or bias into the findings of public opinion polls.
For more details on Gallup's polling methodology, visit https://www.gallup.com/.
