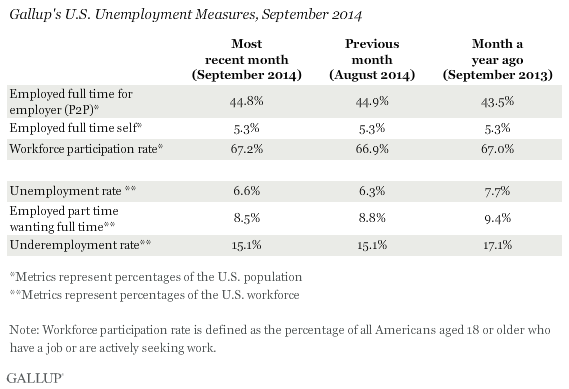
WASHINGTON, D.C. -- The U.S. Payroll to Population employment rate (P2P), as measured by Gallup, was 44.8% in September, similar to the 44.9% in August. This percentage of Americans employed full time for an employer in September is among the highest in any September since Gallup began tracking P2P in January 2010, exceeded only by 45.1% in September 2012.
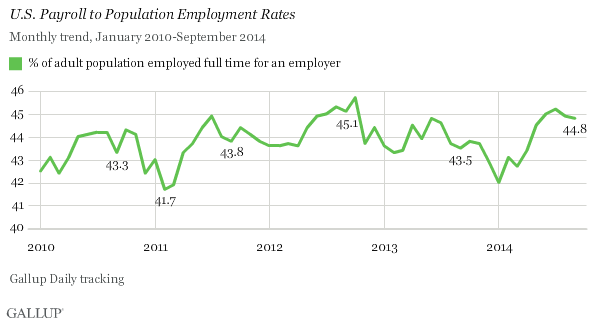
Gallup's P2P metric tracks the percentage of the U.S. adult population aged 18 and older who are employed by an employer for at least 30 hours per week. P2P is not seasonally adjusted. However, because of seasonal fluctuations, year-over-year comparisons are often helpful in evaluating whether monthly changes are attributable to seasonal hiring patterns or true growth (or deterioration) in the percentage of people working full time for an employer.
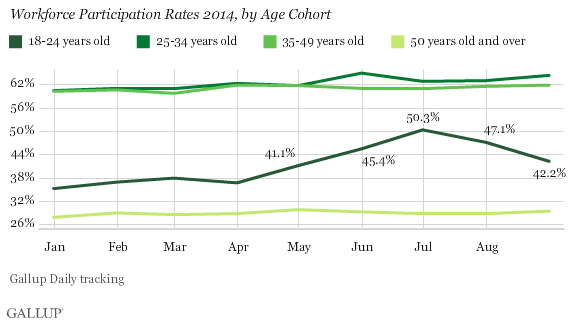
The September P2P rate is generally lower than rates in the summer months of June, July, and August each year, as seasonal work slows down and many younger adults return to school. Indeed, P2P for those aged 18 to 24 fell from 47.1% in August to 42.2% in September. Meanwhile, the combined P2P rate for adults aged 25 and older rose slightly, from 44.6% to 45.2%. Most of this was driven by an increase in the percentage of 25- to 34-year-olds who reported working full time for an employer, from 63.0% in August to 64.3% in September.
The latest results are based on Gallup Daily tracking interviews with 29,323 Americans, conducted Sept. 1-30 by landline telephone and cellphone. Gallup does not count adults who are self-employed, work fewer than 30 hours per week, are unemployed, or are out of the workforce as payroll-employed in the P2P metric.
Workforce Participation at 67.2%
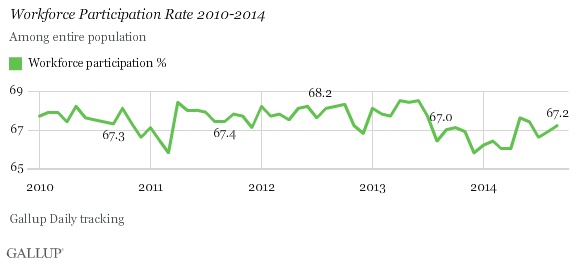
While P2P has held steady over the past couple of months, workforce participation has risen slowly, from 66.6% in July to 67.2% in September.
Workforce participation measures the percentage of adults who are working, or who are not working but are actively looking for work and are available for employment. The workforce participation rate has ranged narrowly between lows of 65.8% to highs of 68.5% since January 2010.
While workforce participation among 18- to 24-year-olds dropped from 80.8% in August to 79.8% in September as many returned to school, 25- to 34-year-olds re-entered the workforce in even greater numbers, with their participation rate rising from 83.7% in August to 85.6% in September.
Unadjusted Unemployment at 6.6%
Gallup's U.S. seasonally unadjusted unemployment rate rose slightly from a record low of 6.3% in July and August to 6.6% in September. However, similar to P2P, unemployment fluctuates seasonally, and the year-over-year change is the most informative comparison. Looking at previous years, unemployment is down from 7.7% in September 2013 and 8.6% in September 2011, continuing its gradual decline over the past few years.
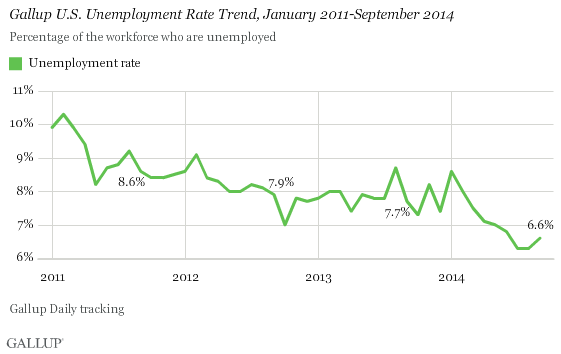
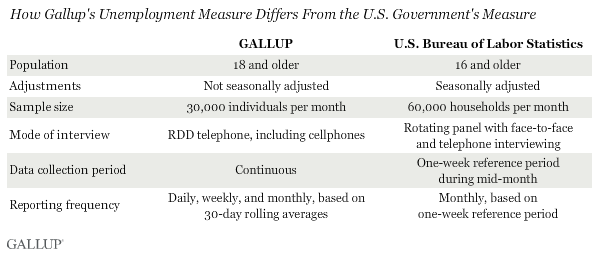
Gallup's U.S. unemployment rate represents the percentage of adults in the workforce who did not have any paid work in the past seven days, for an employer or themselves, and who were actively looking for and available to work. Unlike Gallup's P2P rate, which is a percentage of the total population, traditional employment metrics, such as the unemployment rates Gallup and the U.S. Bureau of Labor Statistics (BLS) report, are based on the percentage of the workforce.
While both Gallup and BLS data are based on robust surveys, the two have important methodological differences. Thus, although Gallup's employment numbers highly correlate with BLS rates, Gallup's numbers tend to have more month-to-month variability, and the unemployment rate as reported by the BLS each month does not always track precisely with the Gallup estimate.
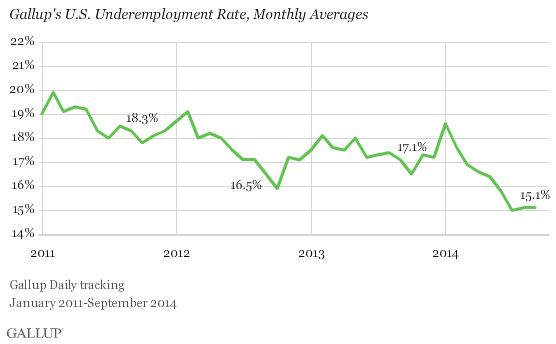
Underemployment, at 15.1%, Near Previous Low
Since falling to 15.0% in July, the lowest in the four-plus year trend, Gallup's measure of underemployment has remained flat through September, at 15.1%. Gallup's U.S. underemployment rate combines the percentage of adults in the workforce who are unemployed (6.6%) and those who are working part time but desire full-time work (8.5%). While unemployment ticked up slightly in September, the percentage of those working part time but wanting full-time work ticked down by the same amount, keeping the overall underemployment metric the same.
Bottom Line
Fittingly, fall is when P2P begins to descend from the seasonal highs of midsummer and when unemployment begins to creep up. These seasonal variations are driven in part by employment changes among 18- to 24-year-olds, who are more likely to be engaged in seasonal summer work and to return to school -- and generally withdraw from the workforce -- in the fall. While that factor is apparent in this month's data, these seasonal changes have been partly offset by increased participation and full-time employment among older adults, particularly 25- to 34-year-olds. This is a positive sign for the economy and especially this age cohort, which has struggled to recover more than older age groups after the Great Recession.
Workforce participation continues to be lower in 2014 than in prior years, but has continued to increase steadily since July. This trend continues to be more positive than it was in 2013, which is a better sign than if all measures had been moving in a more negative direction.
Gallup.com reports results from these indexes in daily, weekly, and monthly averages and in Gallup.com stories. Complete trend data are always available to view and export in the following charts:
Daily: Employment, Economic Confidence and Job Creation, Consumer Spending
Weekly: Employment, Economic Confidence, Job Creation, Consumer Spending
Read more about Gallup's economic measures.
View our economic release schedule.
Survey Methods
Results for this Gallup poll are based on telephone interviews conducted Sept. 1-31, 2014, on the Gallup Daily tracking survey, with a random sample of 29,323 adults, aged 18 and older, living in all 50 U.S. states and the District of Columbia.
For results based on the total sample of national adults, the margin of sampling error is ±1 percentage points at the 95% confidence level.
Interviews are conducted with respondents on landline telephones and cellular phones, with interviews conducted in Spanish for respondents who are primarily Spanish-speaking. Each sample of national adults includes a minimum quota of 50% cellphone respondents and 50% landline respondents, with additional minimum quotas by time zone within region. Landline and cellular telephone numbers are selected using random-digit-dial methods. Landline respondents are chosen at random within each household on the basis of which member had the most recent birthday.
Samples are weighted to correct for unequal selection probability, nonresponse, and double coverage of landline and cell users in the two sampling frames. They are also weighted to match the national demographics of gender, age, race, Hispanic ethnicity, education, region, population density, and phone status (cellphone only/landline only/both, and cellphone mostly). Demographic weighting targets are based on the most recent Current Population Survey figures for the aged 18 and older U.S. population. Phone status targets are based on the most recent National Health Interview Survey. Population density targets are based on the most recent U.S. census. All reported margins of sampling error include the computed design effects for weighting.
In addition to sampling error, question wording and practical difficulties in conducting surveys can introduce error or bias into the findings of public opinion polls.
For more details on Gallup's polling methodology, visit www.gallup.com.
