
Story Highlights
- Unemployment is at 6.2%, lowest rate yet measured
- 2014 workforce participation rate remains below previous years
- Participation down almost 2 points since '10 for those aged 35-49
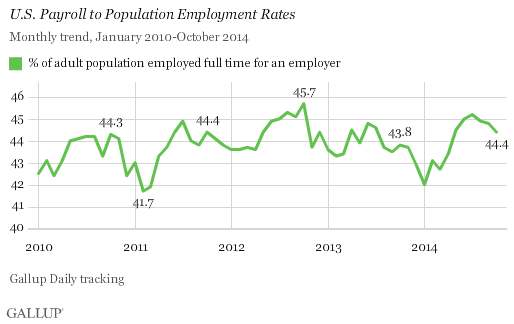
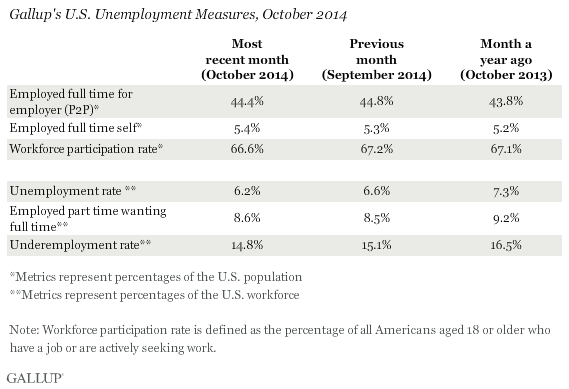
WASHINGTON, D.C. -- The U.S. Payroll to Population employment rate (P2P), as measured by Gallup, was 44.4% in October, down nominally from -- but statistically similar to -- the 44.8% measured in September. This percentage of Americans employed full time for an employer in October is still among the highest in any October since Gallup began tracking P2P in January 2010, exceeded only by the 45.7% in October 2012, the highest single estimate in Gallup's trend.
Gallup's P2P metric tracks the percentage of the U.S. adult population aged 18 and older who are employed by an employer for at least 30 hours per week. The latest results are based on Gallup Daily tracking interviews with 30,401 Americans, conducted Oct. 1-30 by landline telephone and cellphone. Gallup does not count adults who are self-employed, work fewer than 30 hours per week, are unemployed or are out of the workforce as payroll-employed in the P2P metric.
P2P is not seasonally adjusted. However, because of seasonal fluctuations, year-over-year comparisons are often helpful in evaluating whether monthly changes are attributable to seasonal hiring patterns or true growth (or deterioration) in the percentage of people working full time for an employer. The P2P rate generally falls through the autumn months from the highs reached in the summer months of June, July and August each year.
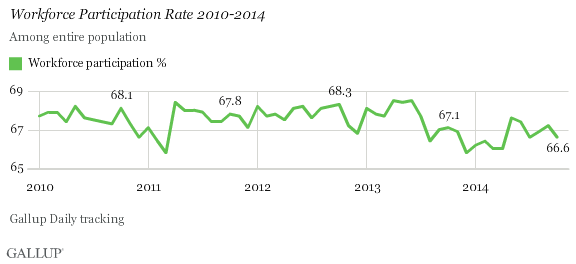
Workforce Participation at 66.6%
Workforce participation among U.S. adults declined slightly to 66.6% in October, from 67.2% in September. Workforce participation measures the percentage of adults 18 and older who are working, or who are not working but are actively looking for work and are available for employment. The workforce participation rate has ranged narrowly between lows of 65.8% and highs of 68.5% since January 2010. However, workforce participation dropped below 67% in August 2013 and has mostly remained below that level since.
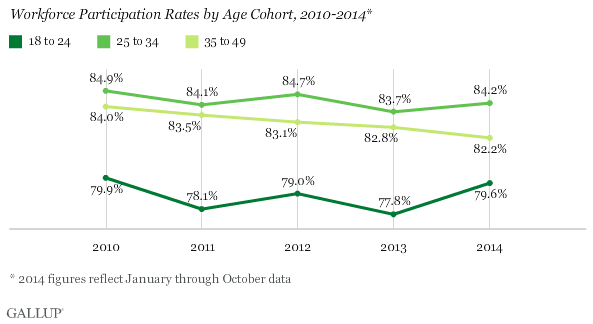
Surprisingly, the age group with the most consistent pattern of declining workforce participation is not "baby boomer" retirees but 35- to 49-year-olds, who should be in their prime working years. This age cohort has seen its workforce participation decline from an annual average of 84.0% in 2010 to 82.8% in 2013 and 82.2% so far in 2014.
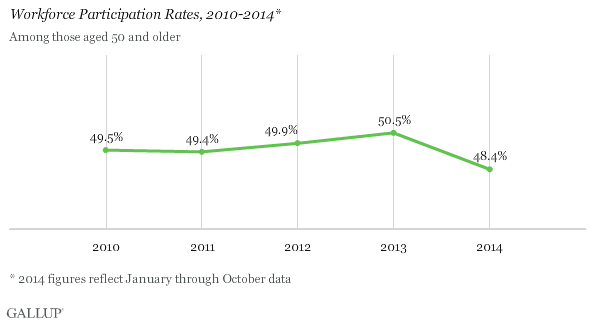
The oldest cohort, those aged 50 and older, actually showed mostly increasing workforce participation through 2013, and has measured lower participation only in 2014 to date, albeit lower than in any year since Gallup began measuring this.
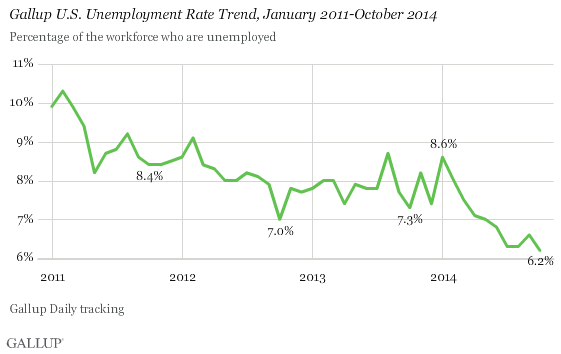
Unadjusted Unemployment at 6.2%
Gallup's U.S. not-seasonally adjusted unemployment rate fell slightly, after a bump up to 6.6% in September, to 6.2% in October -- the lowest unemployment rate observed since Gallup began tracking it in January 2010. Unemployment has so far fallen farther in 2014 -- from 8.6% in January -- than in any of the previous four years. However, unemployment is generally at its lowest level in October of each year, so it is reasonable to expect unemployment to creep back up as the year ends.
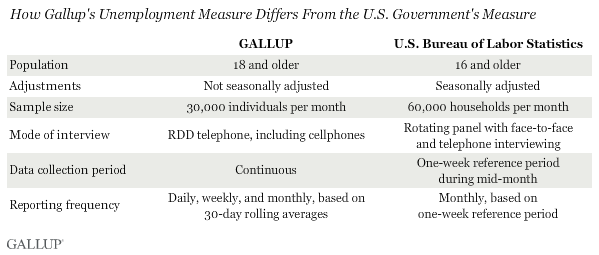
Gallup's U.S. unemployment rate represents the percentage of adults in the workforce who did not have any paid work in the past seven days, for an employer or themselves, and who were actively looking for and available to work. Unlike Gallup's P2P rate, which is a percentage of the total population, traditional employment metrics -- such as the unemployment rates Gallup and the U.S. Bureau of Labor Statistics (BLS) report -- are based on the percentage of the workforce.
While both Gallup and BLS data are based on robust surveys, the two have important methodological differences. Thus, although Gallup's employment numbers highly correlate with BLS rates, Gallup's numbers tend to have more month-to-month variability, and the unemployment rate as reported by the BLS each month does not always track precisely with the Gallup estimate.
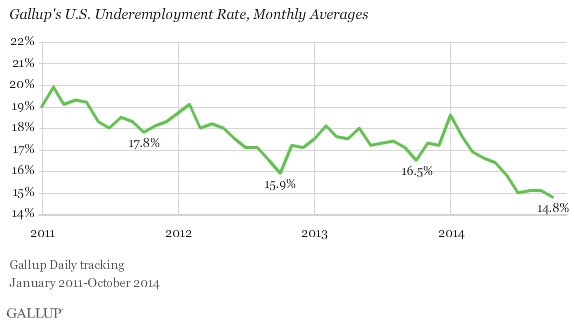
Underemployment at Five-Year Low of 14.8%
Tracking with unemployment, Gallup's measure of underemployment also hit a five-year low in October, at 14.8%. Gallup's U.S. underemployment rate combines the percentage of adults in the workforce who are unemployed (6.2%) and those who are working part time but desire full-time work (8.6%).
Bottom Line
Though the U.S. P2P rate continued its seasonal decline in October, things are still looking up. After a weak year in 2013, the U.S. P2P rate appears to have strengthened in 2014, recovering from a low of 42.0% in January. Unemployment has also resumed its post-recession decline, after a relatively flat year in 2013. These trends point to slow but steady improvement in the overall employment environment in the country.
However, if workforce participation remains weak, these gains may not last. While participation rates remained steady or even rose among those aged 50 and older in recent years, this is likely to change as more baby boomers reach retirement age. Already in 2014, this cohort's participation rate has fallen by more than 2 percentage points from 2013. The steady decline in participation among 35- to 49-year-olds is particularly troubling, as this group is still in its prime working years.
Gallup.com reports results from these indexes in daily, weekly, and monthly averages and in Gallup.com stories. Complete trend data are always available to view and export in the following charts:
Daily: Employment, Economic Confidence and Job Creation, Consumer Spending
Weekly: Employment, Economic Confidence, Job Creation, Consumer Spending
Read more about Gallup's economic measures.
View our economic release schedule.
Survey Methods
Results for this Gallup poll are based on telephone interviews conducted Oct. 1-30, 2014, on the Gallup U.S. Daily survey, with a random sample of 30,401 adults, aged 18 and older, living in all 50 U.S. states and the District of Columbia. For results based on the total sample of national adults, the margin of sampling error is ±1 percentage point at the 95% confidence level.
Each sample of national adults includes a minimum quota of 50% cellphone respondents and 50% landline respondents, with additional minimum quotas by time zone within region. Landline and cellular telephone numbers are selected using random-digit-dial methods.
Learn more about how Gallup Daily tracking works.
