Story Highlights
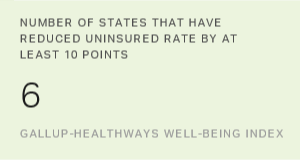
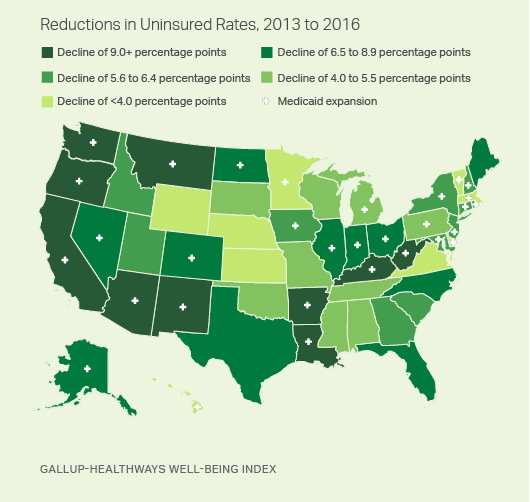
- Six states have reduced uninsured rates by 10 percentage points or more
- States that enacted Medicaid expansion have had larger rate reductions
- No states have increased their uninsured rates since 2013
WASHINGTON, D.C. -- Kentucky and Arkansas have seen the greatest reductions in their adult uninsured rates since several major aspects of the Affordable Care Act (ACA) went into effect, each down over 12 percentage points since 2013. The other four states whose residents report at least 10-point declines since that time are West Virginia, New Mexico, California and Oregon.
| State | Uninsured, 2013 | Uninsured, 2016 | Change | Medicaid expansion | |||||||||||||||||||||||||||||||||||||||||||||||||||||||||||||||||||||||||||||||||||||||||||||||
|---|---|---|---|---|---|---|---|---|---|---|---|---|---|---|---|---|---|---|---|---|---|---|---|---|---|---|---|---|---|---|---|---|---|---|---|---|---|---|---|---|---|---|---|---|---|---|---|---|---|---|---|---|---|---|---|---|---|---|---|---|---|---|---|---|---|---|---|---|---|---|---|---|---|---|---|---|---|---|---|---|---|---|---|---|---|---|---|---|---|---|---|---|---|---|---|---|---|---|---|
| % | % | pct. pts. | |||||||||||||||||||||||||||||||||||||||||||||||||||||||||||||||||||||||||||||||||||||||||||||||||
| Kentucky | 20.4 | 7.8 | -12.6 | Yes | |||||||||||||||||||||||||||||||||||||||||||||||||||||||||||||||||||||||||||||||||||||||||||||||
| Arkansas | 22.5 | 10.2 | -12.3 | Yes | |||||||||||||||||||||||||||||||||||||||||||||||||||||||||||||||||||||||||||||||||||||||||||||||
| West Virginia | 17.6 | 6.1 | -11.5 | Yes | |||||||||||||||||||||||||||||||||||||||||||||||||||||||||||||||||||||||||||||||||||||||||||||||
| New Mexico | 20.2 | 9.0 | -11.2 | Yes | |||||||||||||||||||||||||||||||||||||||||||||||||||||||||||||||||||||||||||||||||||||||||||||||
| California | 21.6 | 10.5 | -11.1 | Yes | |||||||||||||||||||||||||||||||||||||||||||||||||||||||||||||||||||||||||||||||||||||||||||||||
| Oregon | 19.4 | 9.1 | -10.3 | Yes | |||||||||||||||||||||||||||||||||||||||||||||||||||||||||||||||||||||||||||||||||||||||||||||||
| Washington | 16.8 | 7.2 | -9.6 | Yes | |||||||||||||||||||||||||||||||||||||||||||||||||||||||||||||||||||||||||||||||||||||||||||||||
| Arizona | 20.4 | 11.0 | -9.4 | Yes | |||||||||||||||||||||||||||||||||||||||||||||||||||||||||||||||||||||||||||||||||||||||||||||||
| Montana | 20.7 | 11.3 | -9.4 | Yes | |||||||||||||||||||||||||||||||||||||||||||||||||||||||||||||||||||||||||||||||||||||||||||||||
| Louisiana | 21.7 | 12.5 | -9.2 | Yes | |||||||||||||||||||||||||||||||||||||||||||||||||||||||||||||||||||||||||||||||||||||||||||||||
| Gallup-Healthways Well-Being Index | |||||||||||||||||||||||||||||||||||||||||||||||||||||||||||||||||||||||||||||||||||||||||||||||||||
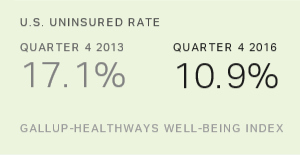
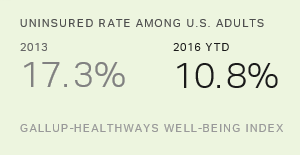
Nationwide, the uninsured rate fell to 10.9% in the fourth quarter of 2016, from 17.3% in 2013.
These data, collected as part of the Gallup-Healthways Well-Being Index, are based on Americans' answers to the question, "Do you have health insurance coverage?" The state-level data are based on daily surveys conducted from January through December 2016 and include state-level sample sizes ranging from 465 randomly selected adult residents in Delaware to more than 17,000 in California. The data for 2013 were also collected over a 12-month period and are based on similar sample sizes for each state. A full list of the 2013 and 2016 uninsured rates for all 50 states appears at the end of this article.
The ACA marketplace exchanges opened on Oct. 1, 2013, and most new insurance plans purchased during the fourth quarter of that year kicked in on Jan. 1, 2014. Medicaid expansion among initially participating states also began in 2014, with many more states expanding since that time. The ACA originally mandated that states expand their Medicaid programs to provide healthcare coverage to more low-income adults. A Supreme Court ruling later overturned this part of the law, essentially making Medicaid expansion for any given state optional. The onset of these two major mechanisms at the beginning of 2014 makes 2013 uninsured rates the natural benchmark point for comparison.
All 10 states with the greatest reductions in their uninsured rates have expanded Medicaid as part of their implementation of the Affordable Care Act.
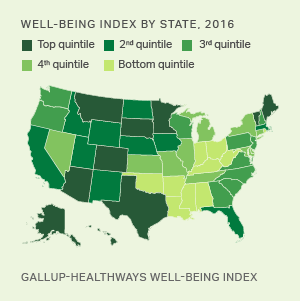
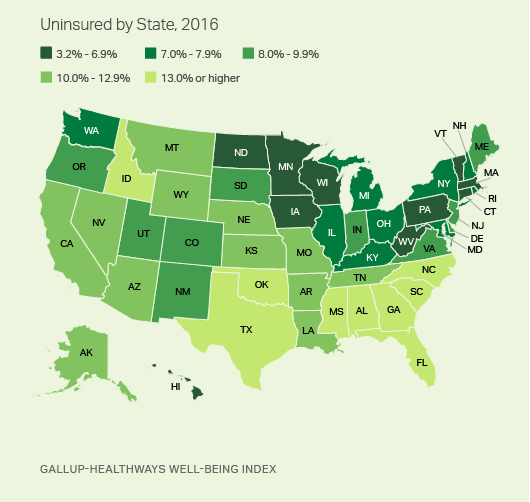
Despite these 10 states having the sharpest reductions in their populations' uninsured rates since 2013, most are not among the states with the lowest uninsured rates overall. Through the end of 2016, 10 states had uninsured rates below 7%: Hawaii, Massachusetts, Iowa, Minnesota, Vermont, West Virginia, Wisconsin, Connecticut, Pennsylvania and North Dakota. West Virginia is the notable exception, as it is among the 10 states with the sharpest uninsured rate reductions since 2013 and among those with the 10 lowest uninsured rates overall in 2016.
For the ninth year in a row, Massachusetts had the lowest uninsured rate nationally in 2016, although it tied for first for the first time (with Hawaii, at 3.2%). Texas had the highest rate for the ninth straight year, at 20.5%, but nevertheless is down 6.5 percentage points since 2013. In general, Southern and Southwestern states continue to have the highest uninsured rates in the U.S.
From 2008 to 2013 -- before key provisions of the ACA were fully implemented -- Massachusetts was the only state with an uninsured rate below 7%. This was the result of a statewide insurance system enacted under former Gov. Mitt Romney.
States Without Medicaid Expansion Less Likely to See Reduction
No state increased its uninsured rate in 2016 compared with 2013. The only states that did not have a statistically significant reduction in their uninsured rates were Kansas and Delaware.
Of the 11 states with the smallest reductions, six have not expanded Medicaid. Among these 11, the states that have expanded Medicaid -- Massachusetts, Hawaii, Vermont, Delaware and Minnesota -- were already among the states with the lowest uninsured rates in the nation in 2013 and therefore had the least room for improvement.
| State | Uninsured, 2013 | Uninsured, 2016 | Change | Medicaid expansion | |||||||||||||||||||||||||||||||||||||||||||||||||||||||||||||||||||||||||||||||||||||||||||||||
|---|---|---|---|---|---|---|---|---|---|---|---|---|---|---|---|---|---|---|---|---|---|---|---|---|---|---|---|---|---|---|---|---|---|---|---|---|---|---|---|---|---|---|---|---|---|---|---|---|---|---|---|---|---|---|---|---|---|---|---|---|---|---|---|---|---|---|---|---|---|---|---|---|---|---|---|---|---|---|---|---|---|---|---|---|---|---|---|---|---|---|---|---|---|---|---|---|---|---|---|
| % | % | pct. pts. | |||||||||||||||||||||||||||||||||||||||||||||||||||||||||||||||||||||||||||||||||||||||||||||||||
| Kansas | 12.5 | 12.3 | -0.2 | No | |||||||||||||||||||||||||||||||||||||||||||||||||||||||||||||||||||||||||||||||||||||||||||||||
| Massachusetts | 4.9 | 3.2 | -1.7 | Yes | |||||||||||||||||||||||||||||||||||||||||||||||||||||||||||||||||||||||||||||||||||||||||||||||
| Delaware | 10.5 | 8.0 | -2.5 | Yes | |||||||||||||||||||||||||||||||||||||||||||||||||||||||||||||||||||||||||||||||||||||||||||||||
| Vermont | 8.9 | 6.1 | -2.8 | Yes | |||||||||||||||||||||||||||||||||||||||||||||||||||||||||||||||||||||||||||||||||||||||||||||||
| Nebraska | 14.5 | 11.2 | -3.3 | No | |||||||||||||||||||||||||||||||||||||||||||||||||||||||||||||||||||||||||||||||||||||||||||||||
| Virginia | 13.3 | 9.8 | -3.5 | No | |||||||||||||||||||||||||||||||||||||||||||||||||||||||||||||||||||||||||||||||||||||||||||||||
| Wyoming | 16.6 | 12.9 | -3.7 | No | |||||||||||||||||||||||||||||||||||||||||||||||||||||||||||||||||||||||||||||||||||||||||||||||
| Minnesota | 9.5 | 5.6 | -3.9 | Yes | |||||||||||||||||||||||||||||||||||||||||||||||||||||||||||||||||||||||||||||||||||||||||||||||
| Hawaii | 7.1 | 3.2 | -3.9 | Yes | |||||||||||||||||||||||||||||||||||||||||||||||||||||||||||||||||||||||||||||||||||||||||||||||
| Alabama | 17.7 | 13.6 | -4.1 | No | |||||||||||||||||||||||||||||||||||||||||||||||||||||||||||||||||||||||||||||||||||||||||||||||
| South Dakota | 14.0 | 9.9 | -4.1 | No | |||||||||||||||||||||||||||||||||||||||||||||||||||||||||||||||||||||||||||||||||||||||||||||||
| Gallup-Healthways Well-Being Index | |||||||||||||||||||||||||||||||||||||||||||||||||||||||||||||||||||||||||||||||||||||||||||||||||||
Overall, the 31 states that have expanded Medicaid as of July 1, 2016, have experienced a sharper reduction in uninsured rates than the states that have not.
Expansion states collectively had an uninsured rate of 15.8% in 2013, cut nearly in half to 8.2% in 2016. Non-expansion states, in turn, had a higher starting rate of 20.2% in 2013 and reduced it to 14.5%, slightly greater than a one-quarter reduction.
| Expansion states | Non-expansion states | ||||||||||||||||||||||||||||||||||||||||||||||||||||||||||||||||||||||||||||||||||||||||||||||||||
|---|---|---|---|---|---|---|---|---|---|---|---|---|---|---|---|---|---|---|---|---|---|---|---|---|---|---|---|---|---|---|---|---|---|---|---|---|---|---|---|---|---|---|---|---|---|---|---|---|---|---|---|---|---|---|---|---|---|---|---|---|---|---|---|---|---|---|---|---|---|---|---|---|---|---|---|---|---|---|---|---|---|---|---|---|---|---|---|---|---|---|---|---|---|---|---|---|---|---|---|
| Uninsured in 2013 (%) | 15.8 | 20.2 | |||||||||||||||||||||||||||||||||||||||||||||||||||||||||||||||||||||||||||||||||||||||||||||||||
| Uninsured in 2016 (%) | 8.2 | 14.5 | |||||||||||||||||||||||||||||||||||||||||||||||||||||||||||||||||||||||||||||||||||||||||||||||||
| Change (pct. pts.) | -7.6 | -5.7 | |||||||||||||||||||||||||||||||||||||||||||||||||||||||||||||||||||||||||||||||||||||||||||||||||
| Reduction since 2013 (%) | 48.1 | 28.2 | |||||||||||||||||||||||||||||||||||||||||||||||||||||||||||||||||||||||||||||||||||||||||||||||||
| Gallup-Healthways Well-Being Index | |||||||||||||||||||||||||||||||||||||||||||||||||||||||||||||||||||||||||||||||||||||||||||||||||||
Bottom Line
By continuously tracking the percentage of Americans who have health insurance, the Well-Being Index concurrently measures those who have retained insurance alongside those who have newly gained coverage and those who were previously insured but have recently lost it. Trends in the uninsured rate, therefore, simultaneously reflect both the lauded effects of the ACA for giving some Americans newfound access to health insurance as well as the criticized outcomes of the ACA that have forced others out of their previously existing plans. The decline in the national uninsured rate (from 17.3% in 2013 to 10.9% in the fourth quarter of 2016), therefore, represents a net decrease of about 15.9 million adults without health insurance over this three-year period.
The reduction in the uninsured rate, however, was only one of several stated goals of the Affordable Care Act. Reducing the rise in healthcare costs and improving Americans' overall health were two others. The latter goal has not yet been realized, as fewer Americans rated their health as "excellent" in 2016 than in 2010 when the healthcare law was signed into effect. Obesity, diabetes and clinical diagnoses of depression are at their highest points since Gallup and Healthways began measurement in 2008.
It is likely that the Affordable Care Act will be modified under President Donald Trump, who has publicly joined Republicans in Congress in their promise to repeal and replace it. Gallup and Healthways will continue to track the uninsured rate to measure the impact of any such action.
These data are available in Gallup Analytics.
Survey Methods
Results are based on telephone interviews conducted Jan. 2-Dec. 30, 2016, as a part of the Gallup-Healthways Well-Being Index, with a random sample of 177,192 adults, aged 18 and older, living in all 50 U.S. states and the District of Columbia. For results based on the total sample of national adults, the margin of sampling error for the uninsured rate is ±0.2 percentage points at the 95% confidence level. The margin of sampling error is ±1 to ±2 percentage points for most states, but climbs to as high as ±3.5 percentage points for states with small populations such as North Dakota, Wyoming, Vermont and Alaska. All reported margins of sampling error include computed design effects for weighting.
Each sample of national adults includes a minimum quota of 60% cellphone respondents and 40% landline respondents, with additional minimum quotas by time zone within region. Landline and cellular telephone numbers are selected using random-digit-dial methods.
Learn more about how the Gallup-Healthways Well-Being Index works.
| State | Uninsured, 2013 | Uninsured, 2016 | Change | Medicaid expansion | 2016 sample | ||||||||||||||||||||||||||||||||||||||||||||||||||||||||||||||||||||||||||||||||||||||||||||||
|---|---|---|---|---|---|---|---|---|---|---|---|---|---|---|---|---|---|---|---|---|---|---|---|---|---|---|---|---|---|---|---|---|---|---|---|---|---|---|---|---|---|---|---|---|---|---|---|---|---|---|---|---|---|---|---|---|---|---|---|---|---|---|---|---|---|---|---|---|---|---|---|---|---|---|---|---|---|---|---|---|---|---|---|---|---|---|---|---|---|---|---|---|---|---|---|---|---|---|---|
| % | % | pct. pts. | |||||||||||||||||||||||||||||||||||||||||||||||||||||||||||||||||||||||||||||||||||||||||||||||||
| Alabama | 17.7 | 13.6 | -4.1 | No | 3,013 | ||||||||||||||||||||||||||||||||||||||||||||||||||||||||||||||||||||||||||||||||||||||||||||||
| Alaska | 18.9 | 11.7 | -7.2 | Yes | 567 | ||||||||||||||||||||||||||||||||||||||||||||||||||||||||||||||||||||||||||||||||||||||||||||||
| Arizona | 20.4 | 11.0 | -9.4 | Yes | 4,403 | ||||||||||||||||||||||||||||||||||||||||||||||||||||||||||||||||||||||||||||||||||||||||||||||
| Arkansas | 22.5 | 10.2 | -12.3 | Yes | 2,014 | ||||||||||||||||||||||||||||||||||||||||||||||||||||||||||||||||||||||||||||||||||||||||||||||
| California | 21.6 | 10.5 | -11.1 | Yes | 17,251 | ||||||||||||||||||||||||||||||||||||||||||||||||||||||||||||||||||||||||||||||||||||||||||||||
| Colorado | 17.0 | 9.3 | -7.7 | Yes | 3,479 | ||||||||||||||||||||||||||||||||||||||||||||||||||||||||||||||||||||||||||||||||||||||||||||||
| Connecticut | 12.3 | 6.2 | -6.1 | Yes | 2,055 | ||||||||||||||||||||||||||||||||||||||||||||||||||||||||||||||||||||||||||||||||||||||||||||||
| Delaware | 10.5 | 8.0 | -2.5 | Yes | 465 | ||||||||||||||||||||||||||||||||||||||||||||||||||||||||||||||||||||||||||||||||||||||||||||||
| Florida | 22.1 | 14.6 | -7.5 | No | 10,943 | ||||||||||||||||||||||||||||||||||||||||||||||||||||||||||||||||||||||||||||||||||||||||||||||
| Georgia | 21.4 | 15.6 | -5.8 | No | 5,309 | ||||||||||||||||||||||||||||||||||||||||||||||||||||||||||||||||||||||||||||||||||||||||||||||
| Hawaii | 7.1 | 3.2 | -3.9 | Yes | 507 | ||||||||||||||||||||||||||||||||||||||||||||||||||||||||||||||||||||||||||||||||||||||||||||||
| Idaho | 19.9 | 14.0 | -5.9 | No | 1,253 | ||||||||||||||||||||||||||||||||||||||||||||||||||||||||||||||||||||||||||||||||||||||||||||||
| Illinois | 15.5 | 7.7 | -7.8 | Yes | 5,513 | ||||||||||||||||||||||||||||||||||||||||||||||||||||||||||||||||||||||||||||||||||||||||||||||
| Indiana | 15.3 | 8.6 | -6.7 | Yes | 3,836 | ||||||||||||||||||||||||||||||||||||||||||||||||||||||||||||||||||||||||||||||||||||||||||||||
| Iowa | 9.7 | 3.9 | -5.8 | Yes | 2,028 | ||||||||||||||||||||||||||||||||||||||||||||||||||||||||||||||||||||||||||||||||||||||||||||||
| Kansas | 12.5 | 12.3 | -0.2 | No | 1,740 | ||||||||||||||||||||||||||||||||||||||||||||||||||||||||||||||||||||||||||||||||||||||||||||||
| Kentucky | 20.4 | 7.8 | -12.6 | Yes | 2,638 | ||||||||||||||||||||||||||||||||||||||||||||||||||||||||||||||||||||||||||||||||||||||||||||||
| Louisiana | 21.7 | 12.5 | -9.2 | Yes | 2,426 | ||||||||||||||||||||||||||||||||||||||||||||||||||||||||||||||||||||||||||||||||||||||||||||||
| Maine | 16.1 | 9.1 | -7.0 | No | 979 | ||||||||||||||||||||||||||||||||||||||||||||||||||||||||||||||||||||||||||||||||||||||||||||||
| Maryland | 12.9 | 7.3 | -5.6 | Yes | 3,204 | ||||||||||||||||||||||||||||||||||||||||||||||||||||||||||||||||||||||||||||||||||||||||||||||
| Massachusetts | 4.9 | 3.2 | -1.7 | Yes | 3,860 | ||||||||||||||||||||||||||||||||||||||||||||||||||||||||||||||||||||||||||||||||||||||||||||||
| Michigan | 12.5 | 7.0 | -5.5 | Yes | 4,872 | ||||||||||||||||||||||||||||||||||||||||||||||||||||||||||||||||||||||||||||||||||||||||||||||
| Minnesota | 9.5 | 5.6 | -3.9 | Yes | 3,395 | ||||||||||||||||||||||||||||||||||||||||||||||||||||||||||||||||||||||||||||||||||||||||||||||
| Mississippi | 22.4 | 17.2 | -5.2 | No | 1,655 | ||||||||||||||||||||||||||||||||||||||||||||||||||||||||||||||||||||||||||||||||||||||||||||||
| Missouri | 15.2 | 10.4 | -4.8 | No | 3,341 | ||||||||||||||||||||||||||||||||||||||||||||||||||||||||||||||||||||||||||||||||||||||||||||||
| Montana | 20.7 | 11.3 | -9.4 | Yes | 1,074 | ||||||||||||||||||||||||||||||||||||||||||||||||||||||||||||||||||||||||||||||||||||||||||||||
| Nebraska | 14.5 | 11.2 | -3.3 | No | 1,460 | ||||||||||||||||||||||||||||||||||||||||||||||||||||||||||||||||||||||||||||||||||||||||||||||
| Nevada | 20.0 | 11.2 | -8.8 | Yes | 1,481 | ||||||||||||||||||||||||||||||||||||||||||||||||||||||||||||||||||||||||||||||||||||||||||||||
| New Hampshire | 13.8 | 7.6 | -6.2 | Yes | 743 | ||||||||||||||||||||||||||||||||||||||||||||||||||||||||||||||||||||||||||||||||||||||||||||||
| New Jersey | 14.9 | 9.3 | -5.6 | Yes | 4,569 | ||||||||||||||||||||||||||||||||||||||||||||||||||||||||||||||||||||||||||||||||||||||||||||||
| New Mexico | 20.2 | 9.0 | -11.2 | Yes | 1,443 | ||||||||||||||||||||||||||||||||||||||||||||||||||||||||||||||||||||||||||||||||||||||||||||||
| New York | 12.6 | 7.0 | -5.6 | Yes | 10,303 | ||||||||||||||||||||||||||||||||||||||||||||||||||||||||||||||||||||||||||||||||||||||||||||||
| North Carolina | 20.4 | 13.6 | -6.8 | No | 5,765 | ||||||||||||||||||||||||||||||||||||||||||||||||||||||||||||||||||||||||||||||||||||||||||||||
| North Dakota | 15.0 | 6.9 | -8.1 | Yes | 514 | ||||||||||||||||||||||||||||||||||||||||||||||||||||||||||||||||||||||||||||||||||||||||||||||
| Ohio | 13.9 | 7.4 | -6.5 | Yes | 6,432 | ||||||||||||||||||||||||||||||||||||||||||||||||||||||||||||||||||||||||||||||||||||||||||||||
| Oklahoma | 21.4 | 16.3 | -5.1 | No | 2,667 | ||||||||||||||||||||||||||||||||||||||||||||||||||||||||||||||||||||||||||||||||||||||||||||||
| Oregon | 19.4 | 9.1 | -10.3 | Yes | 3,015 | ||||||||||||||||||||||||||||||||||||||||||||||||||||||||||||||||||||||||||||||||||||||||||||||
| Pennsylvania | 11.0 | 6.3 | -4.7 | Yes | 7,980 | ||||||||||||||||||||||||||||||||||||||||||||||||||||||||||||||||||||||||||||||||||||||||||||||
| Rhode Island | 13.3 | 7.0 | -6.3 | Yes | 635 | ||||||||||||||||||||||||||||||||||||||||||||||||||||||||||||||||||||||||||||||||||||||||||||||
| South Carolina | 18.7 | 13.1 | -5.6 | No | 2,692 | ||||||||||||||||||||||||||||||||||||||||||||||||||||||||||||||||||||||||||||||||||||||||||||||
| South Dakota | 14.0 | 9.9 | -4.1 | No | 546 | ||||||||||||||||||||||||||||||||||||||||||||||||||||||||||||||||||||||||||||||||||||||||||||||
| Tennessee | 16.8 | 11.8 | -5.0 | No | 4,194 | ||||||||||||||||||||||||||||||||||||||||||||||||||||||||||||||||||||||||||||||||||||||||||||||
| Texas | 27.0 | 20.5 | -6.5 | No | 13,280 | ||||||||||||||||||||||||||||||||||||||||||||||||||||||||||||||||||||||||||||||||||||||||||||||
| Utah | 15.6 | 9.7 | -5.9 | No | 2,090 | ||||||||||||||||||||||||||||||||||||||||||||||||||||||||||||||||||||||||||||||||||||||||||||||
| Vermont | 8.9 | 6.1 | -2.8 | Yes | 527 | ||||||||||||||||||||||||||||||||||||||||||||||||||||||||||||||||||||||||||||||||||||||||||||||
| Virginia | 13.3 | 9.8 | -3.5 | No | 5,044 | ||||||||||||||||||||||||||||||||||||||||||||||||||||||||||||||||||||||||||||||||||||||||||||||
| Washington | 16.8 | 7.2 | -9.6 | Yes | 4,491 | ||||||||||||||||||||||||||||||||||||||||||||||||||||||||||||||||||||||||||||||||||||||||||||||
| West Virginia | 17.6 | 6.1 | -11.5 | Yes | 1,107 | ||||||||||||||||||||||||||||||||||||||||||||||||||||||||||||||||||||||||||||||||||||||||||||||
| Wisconsin | 11.7 | 6.2 | -5.5 | No | 3,384 | ||||||||||||||||||||||||||||||||||||||||||||||||||||||||||||||||||||||||||||||||||||||||||||||
| Wyoming | 16.6 | 12.9 | -3.7 | No | 549 | ||||||||||||||||||||||||||||||||||||||||||||||||||||||||||||||||||||||||||||||||||||||||||||||
| Gallup-Healthways Well-Being Index | |||||||||||||||||||||||||||||||||||||||||||||||||||||||||||||||||||||||||||||||||||||||||||||||||||