Story Highlights
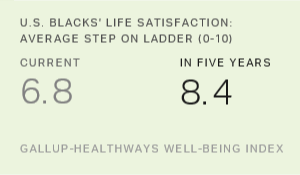
- Blacks rate their current life satisfaction lowest among major groups
- But they rate their anticipated life satisfaction in five years the highest
- Gap in life satisfaction compared with anticipated life is highest for blacks
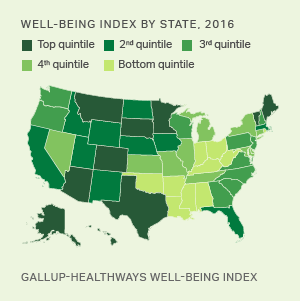
WASHINGTON, D.C. -- Blacks in the U.S. have consistently rated their current satisfaction with their lives lower than have whites, Asians and Hispanics in recent years. At the same time, blacks have been far more optimistic than the other three groups when assessing what their satisfaction with their lives will be like five years in the future.
| White | Black | Asian | Hispanic | ||||||||||||||||||||||||||||||||||||||||||||||||||||||||||||||||||||||||||||||||||||||||||||||||
|---|---|---|---|---|---|---|---|---|---|---|---|---|---|---|---|---|---|---|---|---|---|---|---|---|---|---|---|---|---|---|---|---|---|---|---|---|---|---|---|---|---|---|---|---|---|---|---|---|---|---|---|---|---|---|---|---|---|---|---|---|---|---|---|---|---|---|---|---|---|---|---|---|---|---|---|---|---|---|---|---|---|---|---|---|---|---|---|---|---|---|---|---|---|---|---|---|---|---|---|
| Current life satisfaction (mean) | 7.0 | 6.8 | 7.0 | 7.0 | |||||||||||||||||||||||||||||||||||||||||||||||||||||||||||||||||||||||||||||||||||||||||||||||
| Anticipated life satisfaction in five years (mean) | 7.6 | 8.4 | 8.0 | 8.0 | |||||||||||||||||||||||||||||||||||||||||||||||||||||||||||||||||||||||||||||||||||||||||||||||
| Difference between anticipated life satisfaction in five years and current life satisfaction | +0.6 | +1.6 | +1.0 | +1.0 | |||||||||||||||||||||||||||||||||||||||||||||||||||||||||||||||||||||||||||||||||||||||||||||||
| Gallup-Healthways Well-Being Index | |||||||||||||||||||||||||||||||||||||||||||||||||||||||||||||||||||||||||||||||||||||||||||||||||||
Gallup and Healthways measure Americans' current and anticipated life satisfaction ratings using the following questions based on the Cantril Self-Anchoring Striving Scale:
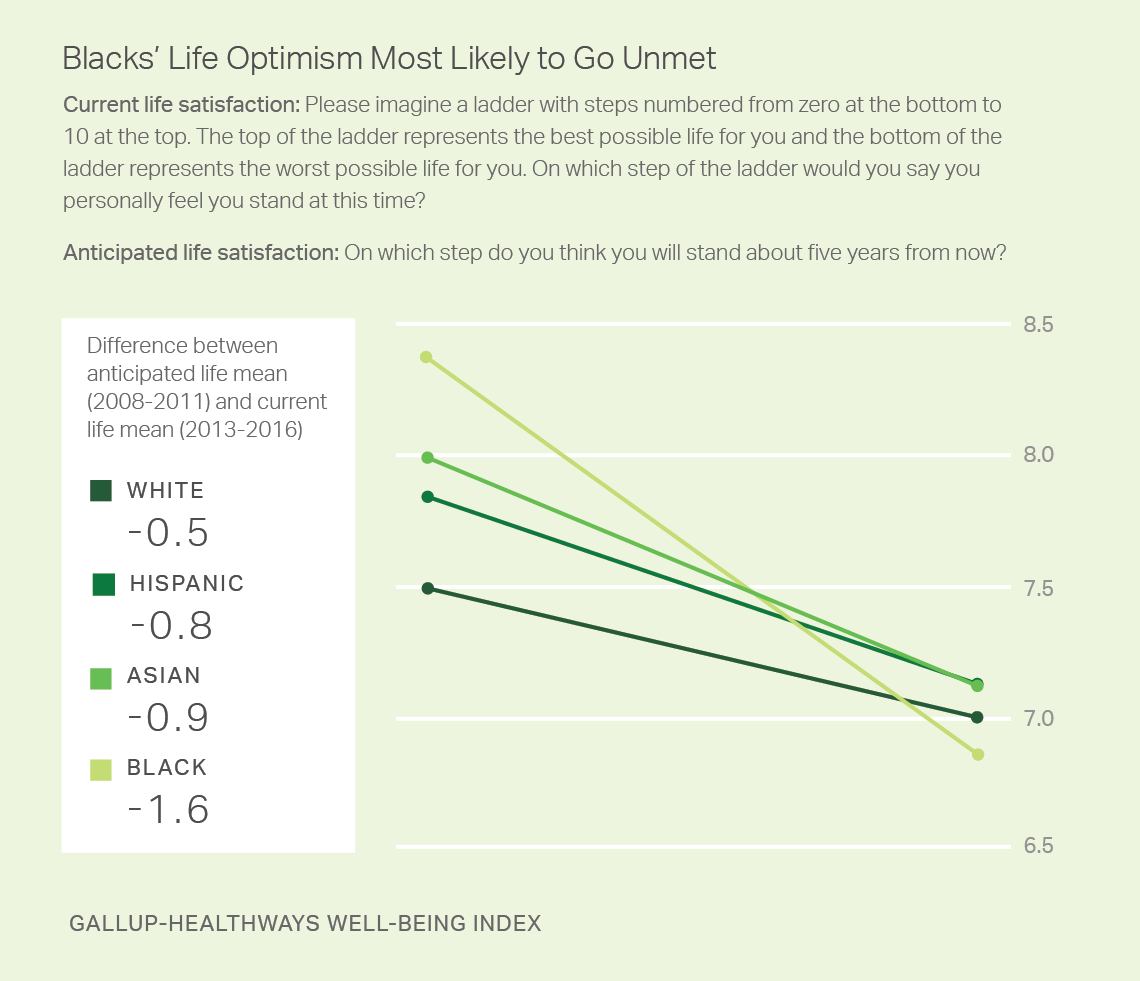
- Current life satisfaction: "Please imagine a ladder with steps numbered from zero at the bottom to 10 at the top. The top of the ladder represents the best possible life for you and the bottom of the ladder represents the worst possible life for you. On which step of the ladder would you say you personally feel you stand at this time?"
-
Anticipated life satisfaction: "On which step do you think you will stand about five years from now?"
In 2008, the first year Gallup and Healthways measured life satisfaction using this scale, blacks' current life satisfaction scores averaged 6.6. By 2009 it rose to 6.9 and by 2010 to 7.0. While similar to the rise among Asians, that 0.4-point increase was greater than the increases seen for whites and Hispanics over the same period spanning the inauguration of President Barack Obama and his first two years in office.
After 2012, however, blacks' satisfaction ratings dropped back to the lowest level since 2008 and remained there throughout Obama's second term. Meanwhile, life satisfaction for the remaining three groups either slightly improved or held steady. Whites' life satisfaction ratings reached a nine-year high during Obama's last year in office, in 2016.
The year-over-year trends for anticipated life satisfaction ratings were similar over this period.
| White | Black | Asian | Hispanic | ||||||||||||||||||||||||||||||||||||||||||||||||||||||||||||||||||||||||||||||||||||||||||||||||
|---|---|---|---|---|---|---|---|---|---|---|---|---|---|---|---|---|---|---|---|---|---|---|---|---|---|---|---|---|---|---|---|---|---|---|---|---|---|---|---|---|---|---|---|---|---|---|---|---|---|---|---|---|---|---|---|---|---|---|---|---|---|---|---|---|---|---|---|---|---|---|---|---|---|---|---|---|---|---|---|---|---|---|---|---|---|---|---|---|---|---|---|---|---|---|---|---|---|---|---|
| 2008 | 6.8 | 6.6 | 6.8 | 6.9 | |||||||||||||||||||||||||||||||||||||||||||||||||||||||||||||||||||||||||||||||||||||||||||||||
| 2009 | 6.9 | 6.9 | 6.9 | 6.9 | |||||||||||||||||||||||||||||||||||||||||||||||||||||||||||||||||||||||||||||||||||||||||||||||
| 2010 | 7.0 | 7.0 | 7.1 | 6.9 | |||||||||||||||||||||||||||||||||||||||||||||||||||||||||||||||||||||||||||||||||||||||||||||||
| 2011 | 7.0 | 6.9 | 7.0 | 6.9 | |||||||||||||||||||||||||||||||||||||||||||||||||||||||||||||||||||||||||||||||||||||||||||||||
| 2012 | 6.9 | 7.0 | 7.0 | 7.1 | |||||||||||||||||||||||||||||||||||||||||||||||||||||||||||||||||||||||||||||||||||||||||||||||
| 2013 | 7.0 | 6.8 | 7.1 | 7.0 | |||||||||||||||||||||||||||||||||||||||||||||||||||||||||||||||||||||||||||||||||||||||||||||||
| 2014 | 7.0 | 6.8 | 7.1 | 7.1 | |||||||||||||||||||||||||||||||||||||||||||||||||||||||||||||||||||||||||||||||||||||||||||||||
| 2015 | 7.0 | 6.8 | 7.1 | 7.1 | |||||||||||||||||||||||||||||||||||||||||||||||||||||||||||||||||||||||||||||||||||||||||||||||
| 2016 | 7.1 | 6.8 | 7.1 | 7.0 | |||||||||||||||||||||||||||||||||||||||||||||||||||||||||||||||||||||||||||||||||||||||||||||||
| Gallup-Healthways Well-Being Index | |||||||||||||||||||||||||||||||||||||||||||||||||||||||||||||||||||||||||||||||||||||||||||||||||||
Blacks' Life Satisfaction Predictions Most Likely to Fall Short
Overall, U.S. adults are optimistic about their future lives, estimating their satisfaction will be nearly a step higher on the ladder than how they rate their life today. But this varies considerably across racial and ethnic groups.
Whites are the least optimistic in terms of improving their life satisfaction in the future, but as such have also proven to be the most accurate when comparing their anticipated life satisfaction score from five years earlier with their current score reported five years later -- at only about a half step lower than what they had previously projected. Asians and Hispanics are both close to the overall national average with their anticipated score on the future life ladder close to one point higher that the average score reported five years later.
Among blacks, however, the current life satisfaction reported each year from 2013 through 2016 consistently fell far short of their anticipated future life satisfaction reported five years earlier from 2008 to 2011, a deficit that is much greater than for any other group. For example, blacks' actual rating of their current lives in 2016 was 1.6 steps lower on the ladder scale than what the average anticipated life satisfaction rating was measured for this group in 2011.
Bottom Line
Overall, blacks' life satisfaction in the U.S. was somewhat higher in 2016 than in 2008, but lower than the peak years measured from 2009 through 2012. These middle years represented the peak of the presumed "Obama life satisfaction effect," which appeared to contribute an additive boost in current and anticipated life satisfaction for those who were both black and identified as a Democrat.
Regardless of the year-over-year trends, blacks have consistently reported the highest levels of life optimism for the future of any of the four major race and ethnic groups during Obama's presidency. These higher expectations have been unmet each year, due to many potential contributing factors.
Perceptions of racism are one possible explanation. The percentage of blacks who report that racism against blacks in the U.S. is widespread grew from 72% in 2009 to 82% in 2016, perhaps contrary to the trend that was anticipated when Obama first took office. And the percentage of blacks who viewed Obama's election and presidency as one of the most important advances for blacks in the U.S. has dwindled from 71% in 2009 to just 51% in 2016. Further, fewer Americans in 2016 believe that blacks have as good of a chance as whites to get jobs for which they are qualified than did so in 2009.
Now that the Obama era has ended, it remains to be seen whether the same patterns in current and anticipated life satisfaction ratings for racial and ethnic groups will persist during Donald Trump's administration. Still, the patterns seen during the Obama years suggest a resiliency in blacks' optimism for a future that is characterized not simply by equal opportunity, but also perhaps by equal gains in employment, wages, the justice system, social stature, community safety and love, among other metrics that might ultimately influence their collective well-being, and their pursuit of a life well-lived.
These data are available in Gallup Analytics.
Survey Methods
Results are based on telephone interviews conducted Jan. 2, 2008, through Dec. 20, -2016, as part of the Gallup-Healthways Well-Being Index, with a random sample of adults aged 18 and older, living in all 50 U.S. states and the District of Columbia. The national sample size averaged 350,000 in 2008 to 2012 and approximately 177,000 in 2013 to 2016. In each year since 2013, Gallup has interviewed about 130,000 whites, 16,000 blacks, 16,000 Hispanics and 4,000 Asians, and roughly double those sizes in the preceding years. The margin of sampling error for each reported racial/ethnic group mean score is no more than ±0.3 points in most cases, but climbs to ±0.6 points for Asians, the smallest group. All reported margins of sampling error include computed design effects for weighting.
Each sample of national adults in 2016 includes a minimum quota of 60% cell phone respondents and 40% landline respondents, with additional minimum quotas by time zone within region. Landline and cellular telephone numbers are selected using random-digit-dial methods.
Learn more about how the Gallup-Healthways Well-Being Index works.