Story Highlights
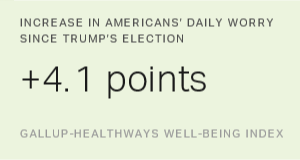
- Worry rose 4.1 percentage points since Trump's election
- This is higher than the 0.9-point increase seen after Obama's first election
- Worry increased most among Democrats
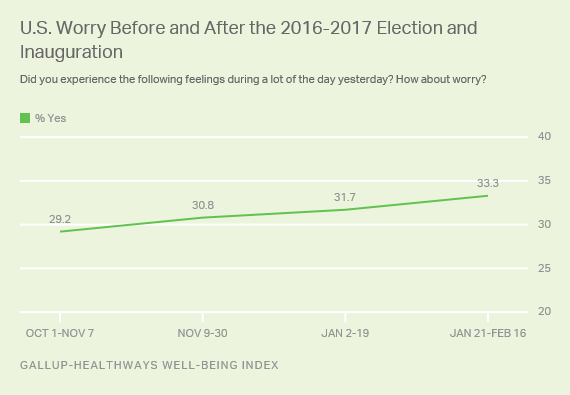
WASHINGTON, D.C. -- Americans' emotional health has suffered since the 2016 election. The average percentage experiencing worry on any given day has increased 4.1 percentage points to 33.3% since early November. Higher levels of worry were first evident after Donald Trump's election in November, but they continued to rise in January and grew more in the first month of Trump's presidency.
These results are based on more than 50,600 interviews with U.S. adults from Oct. 1, 2016, to Feb. 16, 2017, as part of the Gallup-Healthways Well-Being Index.
Gallup and Healthways measure worry by asking respondents whether they "experienced worry during a lot of the day yesterday." Other polls have found that Americans say the election has been a significant source of stress and that they report being less productive since the election. Importantly, these Gallup-Healthways results are based on ongoing questions asked in a survey that did not mention the election specifically or include any other political questions that might have primed respondents to think about worry in political terms.
Gallup and Healthways analyzed Americans' daily reports of worry during four periods: the month leading up to the Nov. 8 election (Oct. 1-Nov. 7), the month following the election (Nov. 9-30), the start of the new year up to the inauguration (Jan. 2-19) and the month after inauguration (Jan. 21-Feb. 16).
The percentage of Americans who say they experienced daily worry increased 1.6 points in the first month after Trump's election, from 29.2% to 30.8%. In January prior to Inauguration Day, it edged up 0.9 points and then rose another 1.6 points in the first month of Trump's presidency. This 4.1-point rise in worry since October is the largest increase seen over a four-month period since the 5.4-point increase recorded in June through October 2008, during the Great Recession and leading up to the financial meltdown that fall.
The 33.3% of Americans feeling worried since Trump's inauguration is the highest monthly average since the 33.7% recorded in September 2011, following the U.S. debt ceiling crisis and Standard & Poor's downgrading of the U.S. credit rating. It is also similar to levels seen during the Great Recession in 2009.
Similar Rise in Worry Not Seen After Obama's First Election
The 4.1-point increase in worry since Trump won the 2016 election is significantly higher than the 0.9-point increase recorded during the comparable period after Barack Obama won the 2008 election.
Clearly signaling that Trump's election and presidency are factors in the recent rise in worry, Democrats' worry has increased much more than Republicans' and independents' since last fall. As a result, Democrats (39.3%) are now much more likely than Republicans (26.5%) and independents (33.6%) to say they worried "a lot of the day yesterday."
Notably, the increase in the percentage of Democrats feeling worried since Trump's victory is significantly greater than the increase among Republicans after Obama's win in 2008, 8.5 points vs. 1.3 points, respectively. Worry is up more sharply among independents since the 2016 election (2.9 points) than it was after the 2008 election (0.7 points).
| U.S. adults | Republicans | Independents | Democrats | |||||||||||||||||||||||||||||||||||||||||||||||||||||||||||||||||||||||||||||||||||||||||||||||||
|---|---|---|---|---|---|---|---|---|---|---|---|---|---|---|---|---|---|---|---|---|---|---|---|---|---|---|---|---|---|---|---|---|---|---|---|---|---|---|---|---|---|---|---|---|---|---|---|---|---|---|---|---|---|---|---|---|---|---|---|---|---|---|---|---|---|---|---|---|---|---|---|---|---|---|---|---|---|---|---|---|---|---|---|---|---|---|---|---|---|---|---|---|---|---|---|---|---|---|---|---|
| % | % | % | % | |||||||||||||||||||||||||||||||||||||||||||||||||||||||||||||||||||||||||||||||||||||||||||||||||
| 2008-2009 | ||||||||||||||||||||||||||||||||||||||||||||||||||||||||||||||||||||||||||||||||||||||||||||||||||||
| Pre-Election | 34.7 | 28.3 | 36.1 | 37.9 | ||||||||||||||||||||||||||||||||||||||||||||||||||||||||||||||||||||||||||||||||||||||||||||||||
| Post-Inauguration | 35.6 | 29.6 | 36.8 | 38.3 | ||||||||||||||||||||||||||||||||||||||||||||||||||||||||||||||||||||||||||||||||||||||||||||||||
| Change (pct. pts.) | +0.9 | +1.3 | +0.7 | +0.4 | ||||||||||||||||||||||||||||||||||||||||||||||||||||||||||||||||||||||||||||||||||||||||||||||||
| 2016-2017 | ||||||||||||||||||||||||||||||||||||||||||||||||||||||||||||||||||||||||||||||||||||||||||||||||||||
| Pre-Election | 29.2 | 25.7 | 30.7 | 30.8 | ||||||||||||||||||||||||||||||||||||||||||||||||||||||||||||||||||||||||||||||||||||||||||||||||
| Post-Inauguration | 33.3 | 26.5 | 33.6 | 39.3 | ||||||||||||||||||||||||||||||||||||||||||||||||||||||||||||||||||||||||||||||||||||||||||||||||
| Change (pct. pts.) | +4.1 | +0.8 | +2.9 | +8.5 | ||||||||||||||||||||||||||||||||||||||||||||||||||||||||||||||||||||||||||||||||||||||||||||||||
| Pre-election survey dates: Oct. 1-Nov. 3, 2008, and Oct. 1-Nov. 7, 2016. Post-inauguration survey dates: Jan. 21-Feb. 16, 2009, and Jan. 21-Feb. 16, 2017. | ||||||||||||||||||||||||||||||||||||||||||||||||||||||||||||||||||||||||||||||||||||||||||||||||||||
| Gallup-Healthways Well-Being Index | ||||||||||||||||||||||||||||||||||||||||||||||||||||||||||||||||||||||||||||||||||||||||||||||||||||
The differences in the worry patterns following the 2016 vs. 2008 elections suggest the steady rise in worry since Trump's election reflects more than just typical concern among those whose candidate lost the election. There appears to be something about Trump in particular -- possibly his controversial statements and actions after being elected and during his first few weeks in office -- that may be contributing to a larger rise in worry now than after the 2008 election.
The unexpected nature of Trump's victory could also factor into Democrats' higher levels of worry since he won the election.
Stress Uptick About the Same as Eight Years Ago
Gallup and Healthways measure Americans' stress in a similar fashion to worry. The average percentage of U.S. adults who report experiencing stress "a lot of the day yesterday" ticked up 1.1 points between Trump's election and the month after his inauguration, to 40.6%. This rise in stress is essentially the same as the 1.2-point increase recorded after Obama's election and inauguration. The current level of stress is slightly higher than the 39.9% average since Gallup and Healthways began tracking this metric in 2008.
Worry Increased Across All Major Subgroups Since Trump's Election
Across all major subgroups, daily worry has risen since Trump's election. In addition to Democrats, those earning more than $90,000 per year, blacks, those aged 30 to 45 and women have experienced the sharpest increases in worry. Republicans, the unemployed and those with some college education have experienced the smallest upticks.
| Oct 1-Nov 7, 2016 | Jan 21-Feb 16, 2017 | Change | |||||||||||||||||||||||||||||||||||||||||||||||||||||||||||||||||||||||||||||||||||||||||||||||||
|---|---|---|---|---|---|---|---|---|---|---|---|---|---|---|---|---|---|---|---|---|---|---|---|---|---|---|---|---|---|---|---|---|---|---|---|---|---|---|---|---|---|---|---|---|---|---|---|---|---|---|---|---|---|---|---|---|---|---|---|---|---|---|---|---|---|---|---|---|---|---|---|---|---|---|---|---|---|---|---|---|---|---|---|---|---|---|---|---|---|---|---|---|---|---|---|---|---|---|---|
| % | % | pct. pts. | |||||||||||||||||||||||||||||||||||||||||||||||||||||||||||||||||||||||||||||||||||||||||||||||||
| U.S. adults | 29.2 | 33.3 | +4.1 | ||||||||||||||||||||||||||||||||||||||||||||||||||||||||||||||||||||||||||||||||||||||||||||||||
| Republicans | 25.7 | 26.5 | +0.8 | ||||||||||||||||||||||||||||||||||||||||||||||||||||||||||||||||||||||||||||||||||||||||||||||||
| Independents | 30.7 | 33.6 | +2.9 | ||||||||||||||||||||||||||||||||||||||||||||||||||||||||||||||||||||||||||||||||||||||||||||||||
| Democrats | 30.8 | 39.3 | +8.5 | ||||||||||||||||||||||||||||||||||||||||||||||||||||||||||||||||||||||||||||||||||||||||||||||||
| 18 to 29 years | 30.8 | 34.5 | +3.7 | ||||||||||||||||||||||||||||||||||||||||||||||||||||||||||||||||||||||||||||||||||||||||||||||||
| 30 to 45 years | 30.7 | 36.3 | +5.6 | ||||||||||||||||||||||||||||||||||||||||||||||||||||||||||||||||||||||||||||||||||||||||||||||||
| 46 to 64 years | 31.9 | 35.8 | +3.9 | ||||||||||||||||||||||||||||||||||||||||||||||||||||||||||||||||||||||||||||||||||||||||||||||||
| 65+ years | 20.6 | 24.7 | +4.1 | ||||||||||||||||||||||||||||||||||||||||||||||||||||||||||||||||||||||||||||||||||||||||||||||||
| Men | 26.7 | 29.6 | +2.9 | ||||||||||||||||||||||||||||||||||||||||||||||||||||||||||||||||||||||||||||||||||||||||||||||||
| Women | 31.5 | 36.8 | +5.3 | ||||||||||||||||||||||||||||||||||||||||||||||||||||||||||||||||||||||||||||||||||||||||||||||||
| Less than 36K | 39.5 | 42.3 | +2.8 | ||||||||||||||||||||||||||||||||||||||||||||||||||||||||||||||||||||||||||||||||||||||||||||||||
| 36K to 90K | 26.8 | 30.0 | +3.2 | ||||||||||||||||||||||||||||||||||||||||||||||||||||||||||||||||||||||||||||||||||||||||||||||||
| 90K+ | 24.6 | 30.4 | +5.8 | ||||||||||||||||||||||||||||||||||||||||||||||||||||||||||||||||||||||||||||||||||||||||||||||||
| High school or less | 29.9 | 34.8 | +4.9 | ||||||||||||||||||||||||||||||||||||||||||||||||||||||||||||||||||||||||||||||||||||||||||||||||
| Some college | 29.9 | 32.2 | +2.3 | ||||||||||||||||||||||||||||||||||||||||||||||||||||||||||||||||||||||||||||||||||||||||||||||||
| College grad | 27.7 | 32.5 | +4.8 | ||||||||||||||||||||||||||||||||||||||||||||||||||||||||||||||||||||||||||||||||||||||||||||||||
| White | 29.1 | 33.2 | +4.1 | ||||||||||||||||||||||||||||||||||||||||||||||||||||||||||||||||||||||||||||||||||||||||||||||||
| Black | 26.0 | 31.6 | +5.6 | ||||||||||||||||||||||||||||||||||||||||||||||||||||||||||||||||||||||||||||||||||||||||||||||||
| Hispanic | 32.6 | 35.3 | +2.7 | ||||||||||||||||||||||||||||||||||||||||||||||||||||||||||||||||||||||||||||||||||||||||||||||||
| Employed | 27.4 | 31.9 | +4.5 | ||||||||||||||||||||||||||||||||||||||||||||||||||||||||||||||||||||||||||||||||||||||||||||||||
| Unemployed | 45.0 | 47.1 | +2.1 | ||||||||||||||||||||||||||||||||||||||||||||||||||||||||||||||||||||||||||||||||||||||||||||||||
| Out of workforce | 30.8 | 34.3 | +3.5 | ||||||||||||||||||||||||||||||||||||||||||||||||||||||||||||||||||||||||||||||||||||||||||||||||
| Gallup-Healthways Well-Being Index | |||||||||||||||||||||||||||||||||||||||||||||||||||||||||||||||||||||||||||||||||||||||||||||||||||
While worry increased across all major subgroups, stress did not. Republicans and the unemployed experienced a dip in stress since Trump's election, possibly because the president's campaign promises appealed to these two groups. Democrats, older Americans, those out of the workforce and Hispanics had the largest increases in stress.
Stress levels among other groups such as middle-income earners, young adults, men and those with some college did not change significantly.
Bottom Line
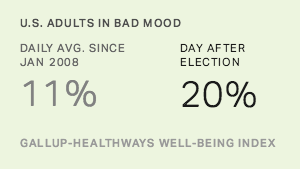
Trump's election victory and first few weeks in office appear to be linked to Americans experiencing more worry in their daily lives. Previous research showed that the percentage of Americans in a bad mood on Election Day 2016 and the day after were among the highest on record since Gallup and Healthways began tracking these emotions daily in January 2008. These new results suggest Americans may be experiencing longer-term worry that has persisted beyond the election and inauguration.
One relatively bright spot in these results is that Americans overall do not appear to be experiencing a large rise in stress, which is linked to health problems such as heart disease, high blood pressure, diabetes and depression.
Still, daily worry can negatively affect Americans' overall well-being. Individuals can become preoccupied with news about the Trump administration and what new policies will mean for themselves and their families. And those highly worried could see their relationships, their work, and their emotional and physical health suffer. To combat this, employers, schools and community organizations could remind individuals about mental health resources available to them and create a culture that makes workers, students and citizens feel emotionally supported.
These data are available in Gallup Analytics.
Survey Methods
Results are based on telephone interviews conducted Oct. 1, 2008-Feb. 16, 2009, and Oct. 1, 2016-Feb. 16, 2017, as part of the Gallup-Healthways Well-Being Index survey, with a random sample of 104,654 adults, aged 18 and older, living in all 50 U.S. states and the District of Columbia in 2008 and 2009 and 50,682 in 2016 and 2017. For results based on the total sample of national adults, the margin of sampling error is ±0.38 percentage points at the 95% confidence level for 2008 and 2009 and ±0.52 for 2016 and 2017.
| Sample size | Margin of error | |||||||||||||||||||||||||||||||||||||||||||||||||||||||||||||||||||||||||||||||||||||||||||||||||||
|---|---|---|---|---|---|---|---|---|---|---|---|---|---|---|---|---|---|---|---|---|---|---|---|---|---|---|---|---|---|---|---|---|---|---|---|---|---|---|---|---|---|---|---|---|---|---|---|---|---|---|---|---|---|---|---|---|---|---|---|---|---|---|---|---|---|---|---|---|---|---|---|---|---|---|---|---|---|---|---|---|---|---|---|---|---|---|---|---|---|---|---|---|---|---|---|---|---|---|---|---|
| ± (pct. pts.) | ||||||||||||||||||||||||||||||||||||||||||||||||||||||||||||||||||||||||||||||||||||||||||||||||||||
| 2008-2009 | ||||||||||||||||||||||||||||||||||||||||||||||||||||||||||||||||||||||||||||||||||||||||||||||||||||
| Republicans | 31,416 | 0.68 | ||||||||||||||||||||||||||||||||||||||||||||||||||||||||||||||||||||||||||||||||||||||||||||||||||
| Independents | 32,486 | 0.68 | ||||||||||||||||||||||||||||||||||||||||||||||||||||||||||||||||||||||||||||||||||||||||||||||||||
| Democrats | 37,312 | 0.63 | ||||||||||||||||||||||||||||||||||||||||||||||||||||||||||||||||||||||||||||||||||||||||||||||||||
| 2016-2017 | ||||||||||||||||||||||||||||||||||||||||||||||||||||||||||||||||||||||||||||||||||||||||||||||||||||
| Republicans | 15,425 | 0.94 | ||||||||||||||||||||||||||||||||||||||||||||||||||||||||||||||||||||||||||||||||||||||||||||||||||
| Independents | 17,242 | 0.89 | ||||||||||||||||||||||||||||||||||||||||||||||||||||||||||||||||||||||||||||||||||||||||||||||||||
| Democrats | 15,660 | 0.95 | ||||||||||||||||||||||||||||||||||||||||||||||||||||||||||||||||||||||||||||||||||||||||||||||||||
| Gallup-Healthways Well-Being Index | ||||||||||||||||||||||||||||||||||||||||||||||||||||||||||||||||||||||||||||||||||||||||||||||||||||
Each sample of national adults includes a minimum quota of 70% cellphone respondents and 30% landline respondents, with additional minimum quotas by time zone within region. Landline and cellular telephone numbers are selected using random-digit-dial methods.
Learn more about how the Gallup-Healthways Well-Being Index works.