Story Highlights
- Index up five points from the prior week
- Best weekly index score since mid-April
- Current conditions score climbs six points
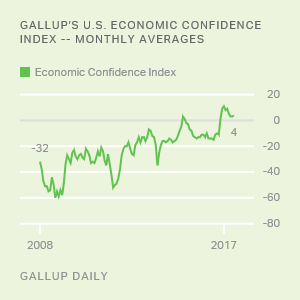
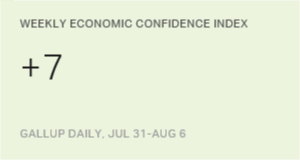
WASHINGTON, D.C. -- Americans' confidence in the economy jumped five points last week, with Gallup's U.S. Economic Confidence Index averaging +7 for the week ending Aug. 6. The latest weekly index score is the highest since mid-April. This bump in economic confidence, recorded mostly before Friday's positive jobs report, comes as the Dow Jones industrial average surpassed the 22,000 milestone.
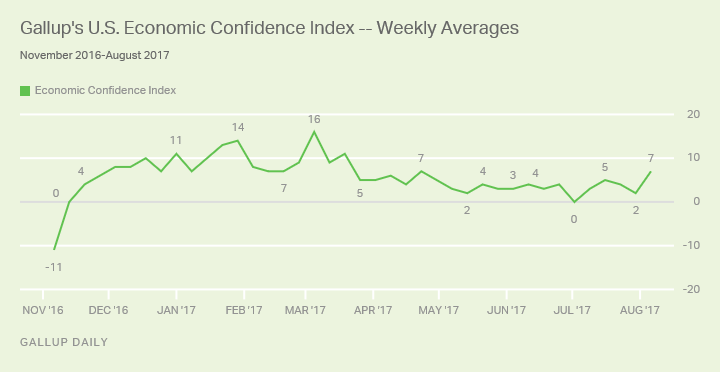
Since mid-April, the Economic Confidence Index has remained within a range of zero to +5. While last week's score of +7 is not as high as the double-digit scores seen in the initial months after last year's election, it remains well above the mostly negative scores Gallup recorded from 2008 to 2016.
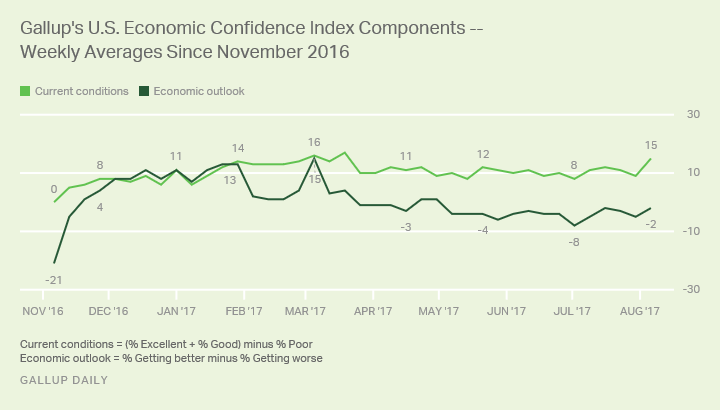
Gallup's U.S. Economic Confidence Index is the average of two components: how Americans rate current economic conditions and whether they feel the economy is improving or getting worse. The index has a theoretical maximum of +100 if all Americans were to say the economy is doing well and improving, and a theoretical minimum of -100 if all were to say the economy is doing poorly and getting worse.
Last week, the current conditions component was +15 -- up six points from the previous week and the best score for this component since mid-March. This score is the result of 35% of Americans describing the economy as "excellent" or "good" and 20% describing it as "poor."
The economic outlook component, meanwhile, improved to a smaller degree, averaging -2 last week. This is based on 46% of Americans saying economic conditions in the country are "getting better" and 48% saying they are "getting worse." This component has been consistently negative since May, ranging between -2 and -8. It was positive for most weeks from mid-November, after Donald Trump was elected, to mid-March.

Gallup Analytics
Subscribe to our online platform and access nearly a century of primary data.
Survey Methods
Results for this Gallup poll are based on telephone interviews conducted July 31-Aug. 6, 2017, on the Gallup U.S. Daily survey, with a random sample of 3,514 adults, aged 18 and older, living in all 50 U.S. states and the District of Columbia. For results based on the total sample of national adults, the margin of sampling error is ±2 percentage points at the 95% confidence level. All reported margins of sampling error include computed design effects for weighting.
Each sample of national adults includes a minimum quota of 70% cellphone respondents and 30% landline respondents, with additional minimum quotas by time zone within region. Landline and cellular telephone numbers are selected using random-digit-dial methods.
Learn more about how the Gallup U.S. Daily works.