Story Highlights
- This year marks a reversal of the three-year upward trend
- Minorities, women, low-income adults and Democrats bear brunt of decline
- Emotional and psychological metrics are primary source of drop
WASHINGTON, D.C. -- Overall well-being among U.S. adults has declined substantially this year. The Gallup-Sharecare Well-Being Index score so far in 2017 is 61.5, down 0.6 points from 62.1 in 2016 and on par with the lower level recorded in 2014. This decline is both statistically significant and meaningfully large.
| 2014 | 2015 | 2016 | 2017 | 2017 vs. 2016 | |||||||||||||||||||||||||||||||||||||||||||||||||||||||||||||||||||||||||||||||||||||||||||||||
|---|---|---|---|---|---|---|---|---|---|---|---|---|---|---|---|---|---|---|---|---|---|---|---|---|---|---|---|---|---|---|---|---|---|---|---|---|---|---|---|---|---|---|---|---|---|---|---|---|---|---|---|---|---|---|---|---|---|---|---|---|---|---|---|---|---|---|---|---|---|---|---|---|---|---|---|---|---|---|---|---|---|---|---|---|---|---|---|---|---|---|---|---|---|---|---|---|---|---|---|
| All adults | 61.6 | 61.7 | 62.1 | 61.5 | -0.6 | ||||||||||||||||||||||||||||||||||||||||||||||||||||||||||||||||||||||||||||||||||||||||||||||
| 2017 YTD data collection: Jan. 2-Sept. 30, 2017 | |||||||||||||||||||||||||||||||||||||||||||||||||||||||||||||||||||||||||||||||||||||||||||||||||||
| Gallup-Sharecare Well-Being Index | |||||||||||||||||||||||||||||||||||||||||||||||||||||||||||||||||||||||||||||||||||||||||||||||||||
These data are drawn from more than 135,000 interviews with U.S. adults across all 50 states from Jan. 2-Sept. 30, 2017, and more than 176,000 interviews each year in 2014, 2015 and 2016.
The Gallup-Sharecare Well-Being Index is calculated on a scale of 0 to 100, where 0 represents the lowest possible well-being and 100 represents the highest possible well-being. The Well-Being Index consists of metrics drawn from each of the five essential elements of well-being:
- Purpose: liking what you do each day and being motivated to achieve your goals
- Social: having supportive relationships and love in your life
- Financial: managing your economic life to reduce stress and increase security
- Community: liking where you live, feeling safe and having pride in your community
- Physical: having good health and enough energy to get things done daily
Democrats' Well-Being Drops Sharply; Republicans' Unchanged
Democrats have suffered a significant decline in overall well-being so far in 2017 compared with 2016. The 0.9-point drop in Democrats' Well-Being Index score is at least triple the decline seen among Republicans and independents. Independents had a statistically significant decline of 0.3 points, while Republicans' well-being is statistically unchanged. The decline among Democrats comes after a notable improvement in 2016, and their well-being is now below 2014 levels.
| 2014 | 2015 | 2016 | 2017 | Change since 2016 | |||||||||||||||||||||||||||||||||||||||||||||||||||||||||||||||||||||||||||||||||||||||||||||||
|---|---|---|---|---|---|---|---|---|---|---|---|---|---|---|---|---|---|---|---|---|---|---|---|---|---|---|---|---|---|---|---|---|---|---|---|---|---|---|---|---|---|---|---|---|---|---|---|---|---|---|---|---|---|---|---|---|---|---|---|---|---|---|---|---|---|---|---|---|---|---|---|---|---|---|---|---|---|---|---|---|---|---|---|---|---|---|---|---|---|---|---|---|---|---|---|---|---|---|---|
| Democrat | 61.4 | 61.5 | 62.0 | 61.1 | -0.9 | ||||||||||||||||||||||||||||||||||||||||||||||||||||||||||||||||||||||||||||||||||||||||||||||
| Independent | 60.6 | 60.4 | 60.6 | 60.3 | -0.3 | ||||||||||||||||||||||||||||||||||||||||||||||||||||||||||||||||||||||||||||||||||||||||||||||
| Republican | 63.9 | 64.1 | 64.1 | 63.9 | -0.2 | ||||||||||||||||||||||||||||||||||||||||||||||||||||||||||||||||||||||||||||||||||||||||||||||
| 2017 YTD data collection: Jan. 2-Sept. 30, 2017 | |||||||||||||||||||||||||||||||||||||||||||||||||||||||||||||||||||||||||||||||||||||||||||||||||||
| Gallup-Sharecare Well-Being Index | |||||||||||||||||||||||||||||||||||||||||||||||||||||||||||||||||||||||||||||||||||||||||||||||||||
Women, Blacks, Hispanics, Low-Income See Large Drops
The overall decline in well-being is concentrated among demographic groups that tend to align with the Democratic Party. Women have had a substantial 1.1-point drop in their Well-Being Index score, while the score for men is unchanged. Across the four major racial and ethnic groups, well-being has dropped the most among blacks and Hispanics, although it has also come down to a lesser degree among whites and Asians. Americans living in lower-income households saw a significant drop in well-being, while their higher-income counterparts saw a smaller decrease, no change or a slight increase.
| 2014 | 2015 | 2016 | 2017 | 2017 vs. 2016 | ||||||||||||||||||||||||||||||||||||||||||||||||||||||||||||||||||||||||||||||||||||||||||||||||
|---|---|---|---|---|---|---|---|---|---|---|---|---|---|---|---|---|---|---|---|---|---|---|---|---|---|---|---|---|---|---|---|---|---|---|---|---|---|---|---|---|---|---|---|---|---|---|---|---|---|---|---|---|---|---|---|---|---|---|---|---|---|---|---|---|---|---|---|---|---|---|---|---|---|---|---|---|---|---|---|---|---|---|---|---|---|---|---|---|---|---|---|---|---|---|---|---|---|---|---|---|
| Gender | ||||||||||||||||||||||||||||||||||||||||||||||||||||||||||||||||||||||||||||||||||||||||||||||||||||
| Male | 60.9 | 61.1 | 61.4 | 61.4 | 0 | |||||||||||||||||||||||||||||||||||||||||||||||||||||||||||||||||||||||||||||||||||||||||||||||
| Female | 62.4 | 62.4 | 62.8 | 61.7 | -1.1 | |||||||||||||||||||||||||||||||||||||||||||||||||||||||||||||||||||||||||||||||||||||||||||||||
| Race/Ethnicity | ||||||||||||||||||||||||||||||||||||||||||||||||||||||||||||||||||||||||||||||||||||||||||||||||||||
| White | 61.7 | 61.8 | 62.2 | 61.9 | -0.3 | |||||||||||||||||||||||||||||||||||||||||||||||||||||||||||||||||||||||||||||||||||||||||||||||
| Black | 59.4 | 59.5 | 59.8 | 58.5 | -1.3 | |||||||||||||||||||||||||||||||||||||||||||||||||||||||||||||||||||||||||||||||||||||||||||||||
| Asian | 64.4 | 63.8 | 64.6 | 64.0 | -0.6 | |||||||||||||||||||||||||||||||||||||||||||||||||||||||||||||||||||||||||||||||||||||||||||||||
| Hispanic | 62.9 | 62.9 | 63.3 | 62.3 | -1.0 | |||||||||||||||||||||||||||||||||||||||||||||||||||||||||||||||||||||||||||||||||||||||||||||||
| Annual income | ||||||||||||||||||||||||||||||||||||||||||||||||||||||||||||||||||||||||||||||||||||||||||||||||||||
| Less than $24,000 | 56.6 | 56.3 | 56.4 | 54.2 | -2.2 | |||||||||||||||||||||||||||||||||||||||||||||||||||||||||||||||||||||||||||||||||||||||||||||||
| $24,000-<$48,000 | 60.0 | 59.7 | 59.7 | 58.8 | -0.9 | |||||||||||||||||||||||||||||||||||||||||||||||||||||||||||||||||||||||||||||||||||||||||||||||
| $48,000-<$90,000 | 62.8 | 62.6 | 62.5 | 62.5 | 0 | |||||||||||||||||||||||||||||||||||||||||||||||||||||||||||||||||||||||||||||||||||||||||||||||
| $90,000-<$120,000 | 64.3 | 64.0 | 64.4 | 64.4 | 0 | |||||||||||||||||||||||||||||||||||||||||||||||||||||||||||||||||||||||||||||||||||||||||||||||
| $120,000+ | 65.7 | 66.2 | 66.4 | 66.7 | +0.3 | |||||||||||||||||||||||||||||||||||||||||||||||||||||||||||||||||||||||||||||||||||||||||||||||
| 2017 YTD data collection: Jan. 2-Sept. 30, 2017 | ||||||||||||||||||||||||||||||||||||||||||||||||||||||||||||||||||||||||||||||||||||||||||||||||||||
| Gallup-Sharecare Well-Being Index | ||||||||||||||||||||||||||||||||||||||||||||||||||||||||||||||||||||||||||||||||||||||||||||||||||||
Emotional Health, Social and Purpose Well-Being All Worsen
The overall decline in well-being in 2017 is driven by dips in emotional health, social well-being and purpose well-being.
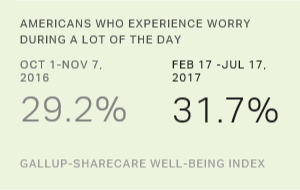
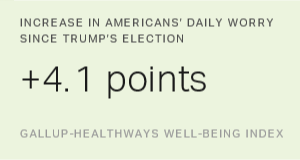
In terms of emotional health, the percentage of adults who report experiencing significant worry on any given day is up, as is the percentage who report having little interest or pleasure in doing things at least some of the time.
Social well-being shows similar declines. Fewer Americans agree that their friends and family provide them with positive energy every day and that someone in their life always encourages them to be healthy, while more disagree with the statement.
Purpose well-being indicators have also receded. Fewer agree and more disagree that there is a leader in their life who makes them enthusiastic about the future and that they like what they do each day.
All of these metrics were highly stable from 2014 through 2016, and in each case the negative movement so far in 2017 is highly statistically significant.
| 2014 | 2015 | 2016 | 2017 | Change since 2016 | ||||||||||||||||||||||||||||||||||||||||||||||||||||||||||||||||||||||||||||||||||||||||||||||||
|---|---|---|---|---|---|---|---|---|---|---|---|---|---|---|---|---|---|---|---|---|---|---|---|---|---|---|---|---|---|---|---|---|---|---|---|---|---|---|---|---|---|---|---|---|---|---|---|---|---|---|---|---|---|---|---|---|---|---|---|---|---|---|---|---|---|---|---|---|---|---|---|---|---|---|---|---|---|---|---|---|---|---|---|---|---|---|---|---|---|---|---|---|---|---|---|---|---|---|---|---|
| Significant daily worry | ||||||||||||||||||||||||||||||||||||||||||||||||||||||||||||||||||||||||||||||||||||||||||||||||||||
| % Yes | 30.0 | 29.9 | 29.5 | 32.1 | +2.6 | |||||||||||||||||||||||||||||||||||||||||||||||||||||||||||||||||||||||||||||||||||||||||||||||
| Little interest or pleasure in doing things | ||||||||||||||||||||||||||||||||||||||||||||||||||||||||||||||||||||||||||||||||||||||||||||||||||||
| % At least some days each week | 35.7 | 34.7 | 33.8 | 41.1 | +7.3 | |||||||||||||||||||||||||||||||||||||||||||||||||||||||||||||||||||||||||||||||||||||||||||||||
| Friends and family give positive energy daily | ||||||||||||||||||||||||||||||||||||||||||||||||||||||||||||||||||||||||||||||||||||||||||||||||||||
| % 4+5 (Agree) | 76.2 | 76.0 | 76.6 | 74.6 | -2.0 | |||||||||||||||||||||||||||||||||||||||||||||||||||||||||||||||||||||||||||||||||||||||||||||||
| % 1+2 (Disagree) | 9.0 | 9.2 | 8.9 | 10.2 | +1.3 | |||||||||||||||||||||||||||||||||||||||||||||||||||||||||||||||||||||||||||||||||||||||||||||||
| Someone in life encourages good health | ||||||||||||||||||||||||||||||||||||||||||||||||||||||||||||||||||||||||||||||||||||||||||||||||||||
| % 4+5 (Agree) | 75.5 | 75.1 | 75.6 | 73.5 | -2.1 | |||||||||||||||||||||||||||||||||||||||||||||||||||||||||||||||||||||||||||||||||||||||||||||||
| % 1+2 (Disagree) | 11.0 | 11.1 | 10.9 | 12.9 | +2.0 | |||||||||||||||||||||||||||||||||||||||||||||||||||||||||||||||||||||||||||||||||||||||||||||||
| Leader in life creates enthusiasm for future | ||||||||||||||||||||||||||||||||||||||||||||||||||||||||||||||||||||||||||||||||||||||||||||||||||||
| % 4+5 (Agree) | 60.5 | 60.8 | 61.3 | 59.5 | -1.8 | |||||||||||||||||||||||||||||||||||||||||||||||||||||||||||||||||||||||||||||||||||||||||||||||
| % 1+2 (Disagree) | 21.5 | 21.3 | 20.8 | 23.0 | +2.2 | |||||||||||||||||||||||||||||||||||||||||||||||||||||||||||||||||||||||||||||||||||||||||||||||
| Like what you do each day | ||||||||||||||||||||||||||||||||||||||||||||||||||||||||||||||||||||||||||||||||||||||||||||||||||||
| % 4+5 (Agree) | 76.1 | 76.2 | 77.3 | 74.5 | -2.8 | |||||||||||||||||||||||||||||||||||||||||||||||||||||||||||||||||||||||||||||||||||||||||||||||
| % 1+2 (Disagree) | 9.0 | 8.9 | 8.4 | 9.6 | +1.2 | |||||||||||||||||||||||||||||||||||||||||||||||||||||||||||||||||||||||||||||||||||||||||||||||
| 2017 YTD data collection: Jan. 2-Sept. 30, 2017 | ||||||||||||||||||||||||||||||||||||||||||||||||||||||||||||||||||||||||||||||||||||||||||||||||||||
| Gallup-Sharecare Well-Being Index | ||||||||||||||||||||||||||||||||||||||||||||||||||||||||||||||||||||||||||||||||||||||||||||||||||||
The remaining three elements, financial, physical and community well-being, have had much smaller changes thus far in 2017. Community well-being is unchanged, while financial and physical well-being are both down slightly.
Implications
After rising in 2016, the Gallup-Sharecare Well-Being Index score has reversed course this year. This drop comes even as key economic metrics closely related to well-being have improved, including unemployment, perceptions of standard of living, confidence in the economy and optimism about spending.
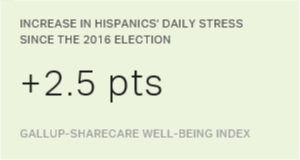
Other signs of worsening well-being in the U.S. include an uptick in the uninsured rate for three quarters in a row and reports of elevated daily worry, particularly among Spanish-speaking Hispanics.
This drop in well-being is important for leaders to monitor and address because research shows the Well-Being Index predicts key health, business and social outcomes.
Read more about the decline in social well-being this past year on the new lifestyle and culture website, Quartzy.
Survey Methods
Results are based on 135,426 telephone interviews with U.S. adults across all 50 states and the District of Columbia, conducted from Jan. 2-Sept. 30, 2017. In 2016, 2015, and 2014, a total of 177,192, 177,281 and 176,702 interviews, respectively, were conducted from Jan. 2-Dec. 30 of each year. Gallup conducts 500 telephone interviews daily, resulting in a sample that projects to an estimated 95% of all U.S. adults.
The Well-Being Index margin of sampling error for the reported groups will range from about ±0.2 points for the U.S. and for whites to about ±0.3 points for blacks and Hispanics to about ±0.6 points for Asians. The margin of error for demographic groups will be no larger than ±0.3 points. All reported margins of sampling error include computed design effects due to weighting.
Each daily sample of national adults for data collected between Jan. 2, 2014 and Sept. 1, 2015, comprised 50% cellphone respondents and 50% landline respondents. Each daily sample from Sept. 1, 2015-Dec. 30, 2016, comprised 60% cellphone respondents and 40% landline respondents. Daily samples in 2017 comprise 70% cellphone respondents and 30% landline respondents. Additional minimum quotas by time zone and within region are included in the sampling approach.
Learn more about how the Gallup-Sharecare Well-Being Index works.