GALLUP NEWS SERVICE
PRINCETON, NJ -- In the last two Gallup Polls, Americans have given George W. Bush the lowest approval ratings of his term. After a term-low 29% rating earlier this month, a new Gallup Poll, conducted July 12-15, finds 31% of Americans approving of Bush. That ties with a reading from May 2006 for the second lowest of his administration.
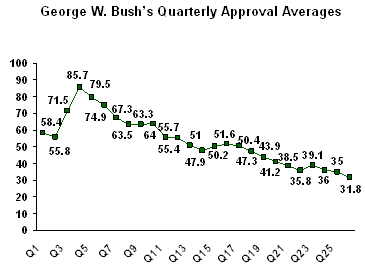
Bush's 26th quarter as president ends on July 19, and it is the worst he has had in terms of his average approval rating. The quarter's 31.8% approval average is more than three percentage points below his previous low, and ranks in the bottom 5% of all quarterly average ratings for presidents since 1945.
Bush's prior worst quarterly average was 35.0% from January through April of this year. He has now averaged below 40% approval in each of the last six quarters, and below 50% in each of the last nine. His recent dismal ratings stand in stark contrast to the 85.7% average approval he enjoyed in his fourth quarter in office (after 9/11), a mark bested only by Truman's 87.0% following the U.S. victory in Europe in World War II.

Bush's current string of sub-40% quarters exceeds the five Richard Nixon had leading up to his resignation from the Oval Office because of the Watergate scandal. Harry Truman had 10 sub-40% quarters at the tail end of his administration. With six quarters remaining in his presidency, Bush would surpass that mark if he averages below 40% for the duration of his term.
Since 1945, Gallup has collected data on 247 presidential quarters. Bush's most recent quarter ties for 234th, putting it in the bottom 5% of all measurements. Of the 12 quarters worse than Bush's most recent one, 6 belong to Truman in 1951-1952, 4 belong to Nixon during the Watergate era of 1973-1974, and 2 to Jimmy Carter during the energy crisis in mid-1979.
|
Lowest Quarterly Approval Averages for Presidents,
|
||||
|
President |
Dates |
Quarter
|
Average
|
No. of
|
|
|
|
% |
|
|
|
Truman |
Oct 20, 1951-Jan 19, 1952 |
27 |
23.0 |
2 |
|
Nixon |
Jul 20-Aug 9, 1974 |
23 |
24.0 |
1 |
|
Truman |
Jan 20-Apr 19, 1952 |
28 |
25.0 |
3 |
|
Nixon |
Apr 20-Jul 19, 1974 |
22 |
26.0 |
7 |
|
Truman |
Apr 20-Jul 19, 1951 |
25 |
26.0 |
3 |
|
Nixon |
Jan 20-Apr 19, 1974 |
21 |
26.1 |
7 |
|
Truman |
Jan 20-Apr 19, 1951 |
24 |
26.3 |
4 |
|
Nixon |
Oct 20, 1973-Jan 19, 1974 |
20 |
28.0 |
5 |
|
Truman |
Apr 20-Jul 19, 1952 |
29 |
29.8 |
4 |
|
Carter |
Apr 20-Jul 19, 1979 |
10 |
30.7 |
6 |
|
Truman |
Jul 20-Oct 19, 1951 |
26 |
30.7 |
3 |
|
Carter |
Jul 20-Oct 19, 1979 |
11 |
31.4 |
7 |
|
Bush |
Apr 20-Jul 19, 2007 |
26 |
31.8 |
6 |
|
Nixon |
Jul 20-Oct 19, 1973 |
19 |
31.8 |
6 |
Bush joins Truman (30.7%) as presidents with very poor approval averages during their 26th quarters in office, after essentially 6 1/2 years in the White House. But not all presidents who served that long suffered low approval ratings. Dwight Eisenhower and Bill Clinton had averages near 60% during their 26th quarters in office, and Ronald Reagan's was just below 50%.
|
Twenty-Sixth Quarter Averages of Other Presidents |
|||
|
President |
Dates of
|
Average
|
No. of
|
|
|
% |
|
|
|
Truman |
July 20-Oct 19, 1951 |
30.7 |
3 |
|
Eisenhower |
Apr 20-Jul 19, 1959 |
62.0 |
3 |
|
Reagan |
Apr 20-Jul 19, 1987 |
49.7 |
3 |
|
Clinton |
Apr 20-Jul 19, 1999 |
58.6 |
9 |
|
G. W. Bush |
Apr 20-Jul 19, 2007 |
31.8 |
6 |
To date, Bush is averaging 39.9% approval in his second term in office, which began on January 20, 2005. Only Nixon and Truman have ever averaged below 40% for a presidential term in office -- both in their second terms. Bush averaged 62% approval during his first term in office, and is following the paths of Truman, Lyndon Johnson, and Nixon, who were much less popular in their second terms than in their first, as a result of prolonged wars, scandals, or both.
|
Presidential Approval Averages by Term in Office |
||
|
President |
First-term
|
Second-term
|
|
|
|
|
|
Truman |
55.6% |
36.5% |
|
Eisenhower |
69.6% |
60.5% |
|
Kennedy |
70.1% |
N/A |
|
Johnson |
74.2% |
50.3% |
|
Nixon |
55.8% |
34.4% |
|
Ford |
47.2% |
N/A |
|
Carter |
45.5% |
N/A |
|
Reagan |
50.3% |
55.3% |
|
G. H. W. Bush |
60.9% |
N/A |
|
Clinton |
49.6% |
60.6% |
|
G. W. Bush |
62.2% |
39.9%* |
|
*As of July 19, 2007 |
||
Survey Methods
These results are based on telephone interviews with a randomly selected national sample of 1,004 adults, aged 18 and older, conducted July 12-15, 2007. For results based on this sample, one can say with 95% confidence that the maximum error attributable to sampling and other random effects is ±3 percentage points.
Results for Bush's 26th quarter approval average are based on combined data from six polls, each of approximately 1,000 adults, conducted between April 20 and July 19, 2007. For results based on this combined sample, one can say with 95% confidence that the maximum error attributable to sampling and other random effects is ±1 percentage point.
In addition to sampling error, question wording and practical difficulties in conducting surveys can introduce error or bias into the findings of public opinion polls.
