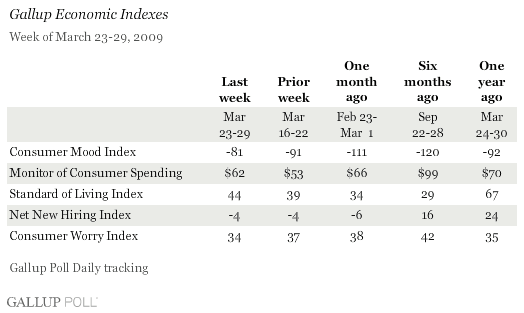
PRINCETON, NJ -- Gallup Poll Daily tracking for the week spanning Monday, March 23 through Sunday, March 29 finds that consumers' mood improved by another 10 points last week and daily consumer spending increased slightly -- by $9, on average, suggesting that consumers are not only feeling better about the economy but also may be feeling a little better about spending.
1. Gallup Consumer Mood Index
(Maximum possible value of 200; minimum possible value of -200)
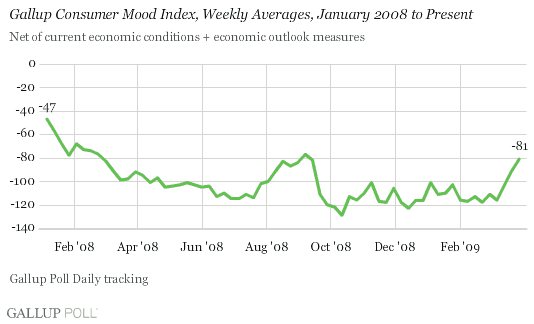
The Gallup Consumer Mood Index improved to -81 for the week ending March 29 from -91 for the week ending March 22. The Index has now improved for three consecutive weeks and is at the pre-financial-crisis level of early September 2008.
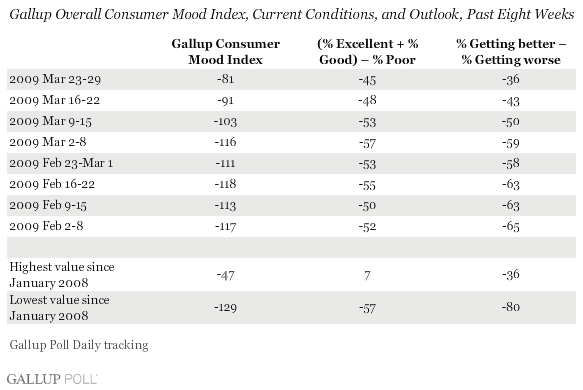
The Consumer Mood Index is based on answers to two questions -- one asking about current conditions and the other about the direction of the economy. An analysis of Americans' perceptions of the economy's direction shows that the percentage saying the economy is getting better has increased for the third week in a row, surging to 29% for the week ending March 29 -- nearly twice the 17% of three weeks ago. On the other dimension -- ratings of the current economy -- the percentage of consumers rating the economy "poor" has also improved steadily over the past three weeks, with the latest week showing 55% providing this rating -- a two-point improvement from the 57% of the prior week.
2. Gallup Monitor of Consumer Spending
(Unlimited maximum possible value; minimum possible value of $0)
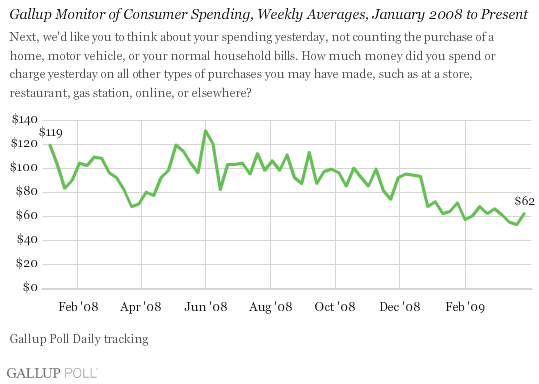
Americans, on average, report spending $62 per day in stores, restaurants, gas stations, or online last week. This represents a $9 increase over the previous week's $53 average, which was the lowest weekly average since Gallup began tracking this measure in January 2008. Spending is still down from a daily average of $70 a year ago. This figure is based on Americans' self-reports of the total amount of money they spent the prior day on purchases other than a home, a motor vehicle, or their normal monthly bills.
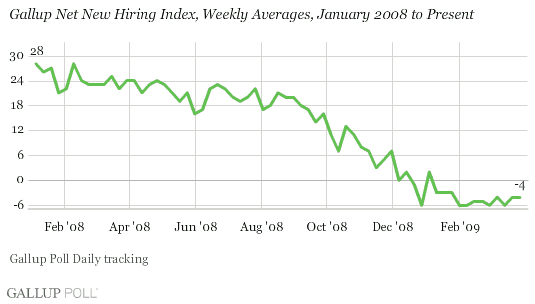
3. Gallup Net New Hiring Index
(Maximum possible value of 100; minimum possible value of -100)
For the week ending March 29, Gallup Poll Daily tracking found 21% of full- and part-time workers saying their employers are hiring people and expanding the number of employees in their workforces, while 25% reported their companies are letting people go and shrinking the size of their workforces. This puts the Net New Hiring Index at -4 for last week, identical to the previous week.
4. Gallup Standard of Living Index
(Maximum possible value of 200; minimum possible value of -200)
The Gallup Standard of Living Index registers 44 for the week ending March 29 -- up from 39 the previous week. This is the highest level for the Index since Jan. 19-25 of this year.
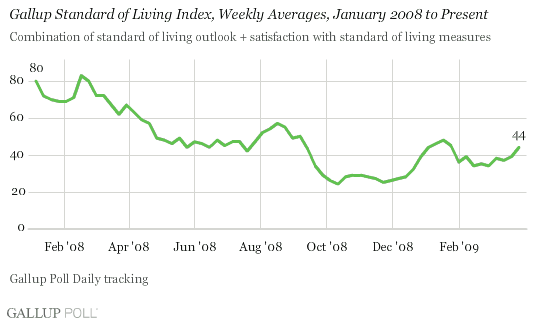
The Standard of Living Index is based on two questions -- one asking about respondents' current standard of living and one about the perceived direction of their standard of living. This past week, nearly as many consumers said their standard of living is getting better (37%) as said it is getting worse (40%). And 73% of consumers said they are satisfied with their standard of living -- essentially the same as in the past several weeks.
5. Gallup Consumer Worry Index
(Maximum possible value of 100; minimum possible value of -0)
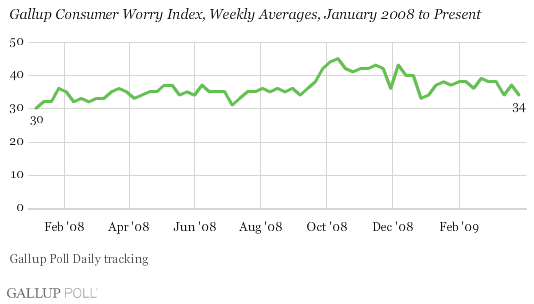
The Gallup Consumer Worry Index is at 34 for the week ending March 29 -- an improvement of three points from the previous week, but identical to the reading for March 9-15.
Commentary
As consumers' mood has surged during recent weeks, the key question for the future of the economy has been whether this would translate into increased consumer spending. The lack of increase in spending over the past couple of weeks as measured by Gallup might have been discouraging to some observers, but a reasonable lag between changes in consumer perceptions and changes in consumer spending is understandable. Although it is too early to tell for sure, Gallup's Monitor of Consumer Spending shows a slight improvement, suggesting consumers' economic outlook may be finally having some positive impact.
Still, this positive development may be challenged in the days and weeks ahead as the Obama administration struggles with the continuing banking crisis and with the immediate need to take action in the auto sector. Much of the recent surge in consumer and investor confidence may be attributable to increased optimism that the economy is bottoming out, the equity markets are recovering, the banking system is being stabilized, and the administration is more confident about the economy's future. The administration's efforts to deal with the auto industry may not only disrupt these perceptions of improvement but could end up turning them negative once more. Additionally, a continuing reversal in the fortunes of the stock market may cause consumers to become more gloomy in their assessments of the economy. Regardless, Gallup Poll Daily tracking will provide immediate insights into the twists and turns of the nation's economy during the weeks and months ahead.
Survey Methods
For Gallup Poll Daily tracking, Gallup interviews approximately 1,000 national adults, aged 18 and older, each day. Gallup's consumer series includes the Gallup Consumer Mood Index (evaluating public perceptions about the U.S. economy), the Gallup Monitor of Consumer Spending (a measure of how much money Americans are spending each day on mainly retail purchases), the Gallup Net New Hiring Index (a measure of employee perceptions of hiring conditions where they work), the Gallup Standard of Living Index (evaluating the public's perceptions about its own standard of living), and the Gallup Consumer Worry Index (a measure of the degree to which Americans are worried about their finances).
The Standard of Living Index is based on questions asked of all respondents; the Gallup Consumer Mood Index, the Gallup Monitor of Consumer Spending, and the Gallup Consumer Worry Index are based on random half-samples of approximately 500 national adults, aged 18 and older, each day. The Gallup Net New Hiring Index is based on a sample of approximately 250 current full- and part-time employees each day.
The sample sizes and associated margins of error for weekly results for the week of March 23-29 are:
Interviews are conducted with respondents on land-line telephones (for respondents with a land-line telephone) and cellular phones (for respondents who are cell-phone only).
In addition to sampling error, question wording and practical difficulties in conducting surveys can introduce error or bias into the findings of public opinion polls.
