Story Highlights
- Economic Confidence Index averaged -3
- Sixth consecutive week at this level
- Economic outlook still below current conditions rating
WASHINGTON, D.C. -- Gallup's Economic Confidence Index averaged -3 for the week ending April 26. The index has been at this level for six weeks, but it is still above where it was for most of 2014. The index is also well above where it was at this time last year, when it measured -17 for the last full week of April 2014.
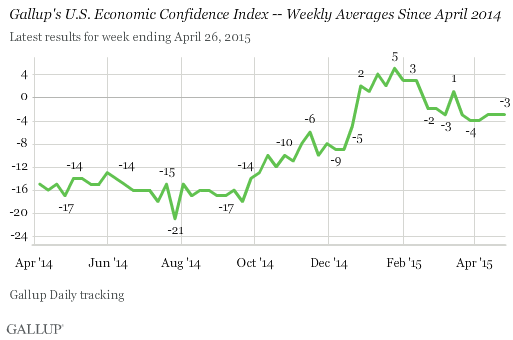
The Economic Confidence Index entered positive territory for the first time since the recession only a few months ago. It rose to +2 at the end of December 2014, and was positive until late February, when it fell back to -2. This was at about the same time gas prices stopped their steady decline, which began at the end of 2014. The index has remained in the narrow range of -2 to -4 since the last week of February, with the exception of an increase to +1 for the week ending March 15.
Gallup's Economic Confidence Index is the average of two components: Americans' ratings of current economic conditions and their views of whether the economy is improving or getting worse. The theoretical maximum of the index is +100, if all Americans say the economy is "excellent" or "good" and "getting better." The theoretical minimum is -100, if all Americans say the economy is "poor" and "getting worse." While the index has steadily been in negative territory for the past six weeks, it is much higher than it was previously, particularly from 2008 through most of 2014.
The current conditions score was unchanged at -1 last week, the result of 26% of Americans saying the economy is excellent or good and 27% saying it is poor. The economic outlook score measured -4 for the same period, similar to the -5 found the week prior. The latest outlook score is the result of 46% of Americans saying the economy is getting better, and 50% saying it is getting worse.
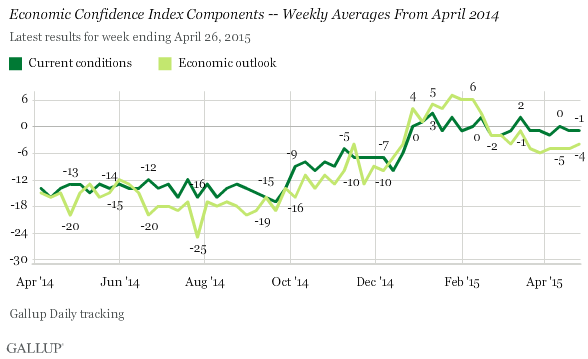
Since early March, Americans have been more positive about the current economy than about the direction in which they perceive it is headed. That has been the case for most of the past year, with the notable exception of the period from mid-December 2014 to mid-February 2015, the weeks when the overall Economic Confidence Index was positive.
The data in this article are available in Gallup Analytics.
Survey Methods
Results for this Gallup poll are based on telephone interviews conducted April 20-26, 2015, on the Gallup U.S. Daily survey, with a random sample of 3,552 adults, aged 18 and older, living in all 50 U.S. states and the District of Columbia. For results based on the total sample of national adults, the margin of sampling error is ±2 percentage points at the 95% confidence level. All reported margins of sampling error include computed design effects for weighting.
Each sample of national adults includes a minimum quota of 50% cellphone respondents and 50% landline respondents, with additional minimum quotas by time zone within region. Landline and cellular telephone numbers are selected using random-digit-dial methods.
Learn more about how Gallup Daily tracking works.