Story Highlights
- Uninsured rate up from 11.7% in second quarter
- It increased 1.4 percentage points since the end of 2016
- Uninsured rate rises most among those with self-paid plans
WASHINGTON, D.C. -- The percentage of U.S. adults lacking health insurance rose in the third quarter of 2017 to 12.3%, up 0.6 percentage points from the previous quarter and 1.4 points since the end of 2016. The uninsured rate is now the highest recorded since the last quarter of 2014 when it was 12.9%.
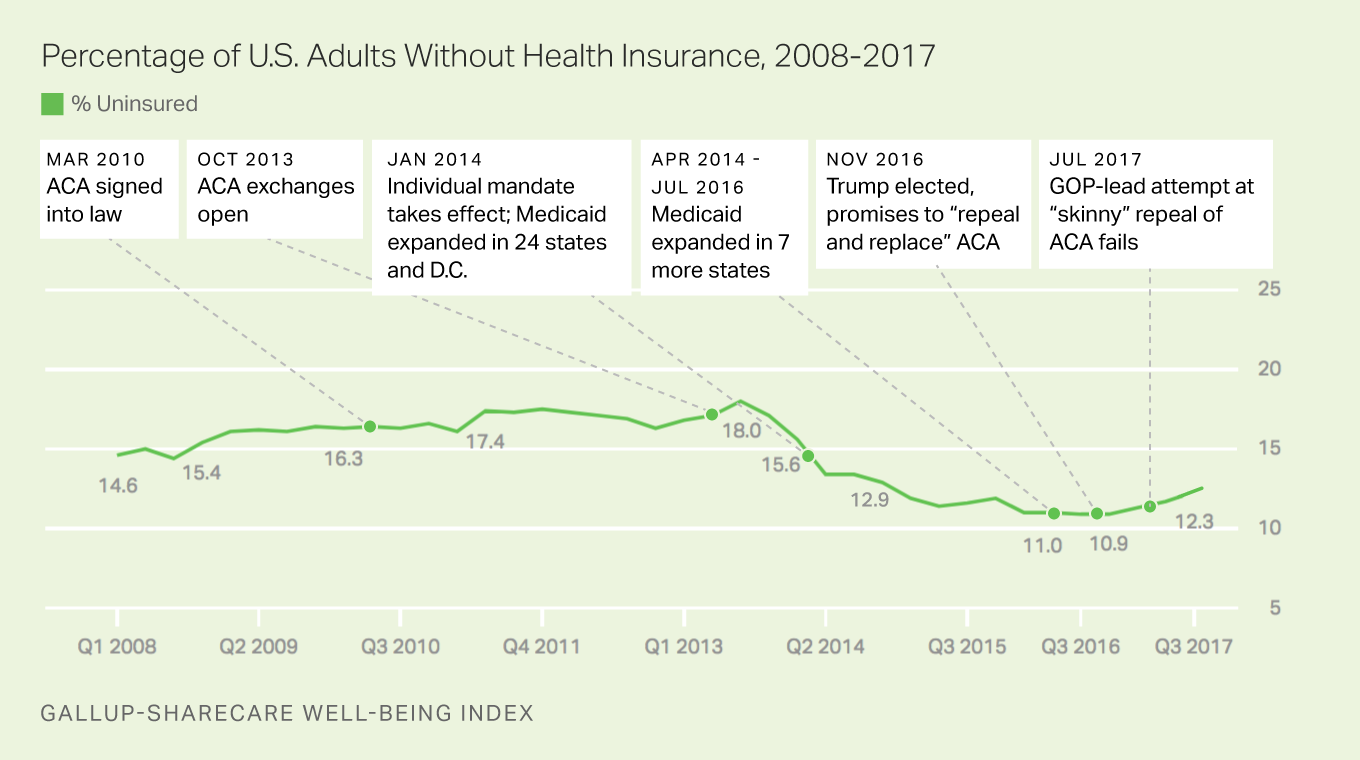
The uninsured rate, measured by Gallup and Sharecare since 2008, had fallen to a record low of 10.9% in the third and fourth quarters of 2016. However, the 1.4-point increase in the percentage of adults without health insurance since the end of last year represents nearly 3.5 million Americans who have entered the ranks of the uninsured.
Still, the uninsured rate remains well below its peak of 18.0% measured in the third quarter of 2013, prior to the implementation of the Affordable Care Act's (ACA) mandated healthcare exchanges and the associated requirement that all adults have health insurance or be subject to a fine.
Several marketplace factors could be contributing to the growth of the uninsured rate since 2016. Some insurance companies have stopped offering insurance through the exchanges, and the lack of competition could be driving up the cost of plans for consumers. As a result, the rising insurance premiums could be compelling some Americans to forgo insurance, especially those who fail to qualify for federal subsidies.
Uncertainty about the healthcare law also may be driving the increase. Congressional Republicans' attempts to replace the healthcare law may be causing consumers to question whether the government will enforce the penalty for not having insurance.
The results for the third quarter of 2017 are based on more than 45,000 interviews with U.S. adults aged 18 and older from July 1 to Sept. 30, conducted as part of the Gallup-Sharecare Well-Being Index. Gallup and Sharecare have asked a random sample of at least 500 U.S. adults each day since January 2008 whether they have health insurance.

Gallup Analytics
Subscribe to our online platform and access nearly a century of primary data.
Coverage Down Among Key Demographic Groups Since 2016
The uninsured rate has increased at least one point among all key demographic subgroups since late 2016, except for those aged 65 and older. The growth has been concentrated mostly among middle-aged Americans, racial minorities and lower-income Americans. The uninsured rate has risen by 1.8 points among those aged 35 to 64, compared with slightly smaller increases among younger (18 to 34) adults.
| Q4 2016 | Q3 2017 | Change | ||||||||||||||||||||||||||||||||||||||||||||||||||||||||||||||||||||||||||||||||||||||||||||||||||
|---|---|---|---|---|---|---|---|---|---|---|---|---|---|---|---|---|---|---|---|---|---|---|---|---|---|---|---|---|---|---|---|---|---|---|---|---|---|---|---|---|---|---|---|---|---|---|---|---|---|---|---|---|---|---|---|---|---|---|---|---|---|---|---|---|---|---|---|---|---|---|---|---|---|---|---|---|---|---|---|---|---|---|---|---|---|---|---|---|---|---|---|---|---|---|---|---|---|---|---|---|
| % | % | pct. pts. | ||||||||||||||||||||||||||||||||||||||||||||||||||||||||||||||||||||||||||||||||||||||||||||||||||
| National Adults | 10.9 | 12.3 | +1.4 | |||||||||||||||||||||||||||||||||||||||||||||||||||||||||||||||||||||||||||||||||||||||||||||||||
| Age | ||||||||||||||||||||||||||||||||||||||||||||||||||||||||||||||||||||||||||||||||||||||||||||||||||||
| 18-64 | 13.1 | 14.8 | +1.7 | |||||||||||||||||||||||||||||||||||||||||||||||||||||||||||||||||||||||||||||||||||||||||||||||||
| 18-25 | 14.7 | 16.2 | +1.5 | |||||||||||||||||||||||||||||||||||||||||||||||||||||||||||||||||||||||||||||||||||||||||||||||||
| 26-34 | 18.9 | 20.3 | +1.4 | |||||||||||||||||||||||||||||||||||||||||||||||||||||||||||||||||||||||||||||||||||||||||||||||||
| 35-64 | 11.0 | 12.8 | +1.8 | |||||||||||||||||||||||||||||||||||||||||||||||||||||||||||||||||||||||||||||||||||||||||||||||||
| 65+ | 2.3 | 2.5 | +0.2 | |||||||||||||||||||||||||||||||||||||||||||||||||||||||||||||||||||||||||||||||||||||||||||||||||
| Race/Ethnicity | ||||||||||||||||||||||||||||||||||||||||||||||||||||||||||||||||||||||||||||||||||||||||||||||||||||
| Non-Hispanic white | 6.9 | 8.0 | +1.1 | |||||||||||||||||||||||||||||||||||||||||||||||||||||||||||||||||||||||||||||||||||||||||||||||||
| Non-Hispanic black | 12.5 | 14.0 | +1.5 | |||||||||||||||||||||||||||||||||||||||||||||||||||||||||||||||||||||||||||||||||||||||||||||||||
| Hispanic | 27.4 | 29.0 | +1.6 | |||||||||||||||||||||||||||||||||||||||||||||||||||||||||||||||||||||||||||||||||||||||||||||||||
| Annual Household Income | ||||||||||||||||||||||||||||||||||||||||||||||||||||||||||||||||||||||||||||||||||||||||||||||||||||
| Less than $36,000 | 20.8 | 22.5 | +1.7 | |||||||||||||||||||||||||||||||||||||||||||||||||||||||||||||||||||||||||||||||||||||||||||||||||
| $36,000 to $90,000 | 9.2 | 10.5 | +1.3 | |||||||||||||||||||||||||||||||||||||||||||||||||||||||||||||||||||||||||||||||||||||||||||||||||
| $90,000+ | 2.7 | 3.8 | +1.1 | |||||||||||||||||||||||||||||||||||||||||||||||||||||||||||||||||||||||||||||||||||||||||||||||||
| Gallup-Sharecare Well-Being Index | ||||||||||||||||||||||||||||||||||||||||||||||||||||||||||||||||||||||||||||||||||||||||||||||||||||
The uninsured rate among black and Hispanic adults has increased by 1.5 and 1.6 points, respectively, since the end of 2016. During that same time period, the uninsured rate among non-Hispanic whites rose by 1.1 points. Lower-income (+1.7 pts.) and middle-income (+1.3 pts.) adults have seen comparatively larger increases in their uninsured rates since 2016 than high-income adults (1.1 pts).
Fewer Americans Purchasing Their Own Health Plans Since 2016
Gallup and Sharecare also track the sources Americans aged 18 to 64 use to obtain their health insurance. Most Americans aged 65 and older receive health coverage through Medicare, so changes to the health insurance system largely do not affect where they receive insurance.
By far, the largest decline in the type of health insurance Americans have obtained since the end of 2016 has been among those who purchase their own plans, likely on ACA exchanges. The percentage of adults with self-paid plans has fallen by 1.3 points, from 21.3% to 20.0%, over this period.
The decline in the percentage of Americans who pay for their own coverage in 2017 represents a reversal of what had been the fastest growing type of coverage since the ACA's individual mandate took effect in the third quarter of 2013. Between then and 2016, the percentage of adults with coverage via self-paid plans had grown 3.7 points.
The next largest change is among those with coverage under Medicare, which has fallen 0.5 points since 2016.
| Q4 2016 | Q3 2017 | Change | |||||||||||||||||||||||||||||||||||||||||||||||||||||||||||||||||||||||||||||||||||||||||||||||||
|---|---|---|---|---|---|---|---|---|---|---|---|---|---|---|---|---|---|---|---|---|---|---|---|---|---|---|---|---|---|---|---|---|---|---|---|---|---|---|---|---|---|---|---|---|---|---|---|---|---|---|---|---|---|---|---|---|---|---|---|---|---|---|---|---|---|---|---|---|---|---|---|---|---|---|---|---|---|---|---|---|---|---|---|---|---|---|---|---|---|---|---|---|---|---|---|---|---|---|---|
| % | % | pct. pts. | |||||||||||||||||||||||||||||||||||||||||||||||||||||||||||||||||||||||||||||||||||||||||||||||||
| Plan fully paid for by self or family member | 21.3 | 20.0 | -1.3 | ||||||||||||||||||||||||||||||||||||||||||||||||||||||||||||||||||||||||||||||||||||||||||||||||
| Medicare | 7.6 | 7.1 | -0.5 | ||||||||||||||||||||||||||||||||||||||||||||||||||||||||||||||||||||||||||||||||||||||||||||||||
| Current or former employer | 44.3 | 43.9 | -0.4 | ||||||||||||||||||||||||||||||||||||||||||||||||||||||||||||||||||||||||||||||||||||||||||||||||
| Something else | 4.6 | 4.4 | -0.2 | ||||||||||||||||||||||||||||||||||||||||||||||||||||||||||||||||||||||||||||||||||||||||||||||||
| A union | 2.7 | 2.7 | 0.0 | ||||||||||||||||||||||||||||||||||||||||||||||||||||||||||||||||||||||||||||||||||||||||||||||||
| Military/Veteran's | 4.7 | 4.7 | 0.0 | ||||||||||||||||||||||||||||||||||||||||||||||||||||||||||||||||||||||||||||||||||||||||||||||||
| Medicaid | 8.8 | 9.3 | +0.5 | ||||||||||||||||||||||||||||||||||||||||||||||||||||||||||||||||||||||||||||||||||||||||||||||||
| No insurance | 13.1 | 14.8 | +1.7 | ||||||||||||||||||||||||||||||||||||||||||||||||||||||||||||||||||||||||||||||||||||||||||||||||
| Gallup-Sharecare Well-Being Index | |||||||||||||||||||||||||||||||||||||||||||||||||||||||||||||||||||||||||||||||||||||||||||||||||||
Gallup and Sharecare began asking Americans about the source of their health insurance using the current question wording in August 2013 in anticipation of shifts in how people would receive their health insurance after the healthcare exchanges opened. Gallup asks Americans, "Is your primary health insurance coverage through a current or former employer, a union, Medicare, Medicaid, military or veteran's coverage, or a plan fully paid for by you or a family member?" Gallup also asks whether they have secondary health insurance coverage and, if so, what type of coverage it is. The results reported here are a combined estimate of primary and secondary insurance types.
Implications
Without Congress and President Donald Trump taking steps to stabilize the insurance markets, the number of uninsured Americans likely will continue to rise. Enrollment for 2018 plans on the ACA exchanges begins Nov. 1, and recent developments suggest premium costs will continue to increase.
Trump last week canceled cost-sharing payments, which help subsidize insurance plans for lower-income Americans. The Congressional Budget Office predicts that this will yield 20% higher premiums in 2018 for the ACA's popular "silver plans" and 25% higher premiums by 2020.
Pennsylvania's acting insurance commissioner announced on Monday that rates in that state will increase by an average of 30% in 2018 after an initial projected increase of 8% prior to the cancelation of the cost-sharing payments.
In early October, Trump personally intervened against granting Iowa's request to the Department of Health and Human Services to waive certain ACA rules that would stabilize the individual insurance market in that state. Failure to approve the waiver, despite pleas from Iowa's two Republican senators, could increase the cost of premiums in that state by 56%, according to Iowa's Republican governor. The week prior, the Trump administration missed the deadline to approve a similar waiver request by Oklahoma's health commissioner, whose own state is facing 30% premium cost hikes in 2018.
Despite these developments in the month before enrollment for 2018 plans begins, Trump said in a press conference this week that legislation on healthcare policy will not be back on the agenda until the beginning or middle of next year.
Survey Methods
Results for this Gallup poll are based on telephone interviews conducted July 1-Sept. 30, 2017, on the Gallup U.S. Daily survey, with a random sample of 45,743 adults, aged 18 and older, living in all 50 U.S. states and the District of Columbia. For results based on the total sample of national adults, the margin of sampling error is ±1 percentage points at the 95% confidence level. All reported margins of sampling error include computed design effects for weighting.
Each sample of national adults includes a minimum quota of 70% cellphone respondents and 30% landline respondents, with additional minimum quotas by time zone within region. Landline and cellular telephone numbers are selected using random-digit-dial methods.
Learn more about how the Gallup-Sharecare Well-Being Index works.