
Story Highlights
- At least 90% satisfied with family life, education, leisure-time activity
- Largest subgroup differences on income, housing, standard of living
- Higher-income Americans more satisfied with all life aspects
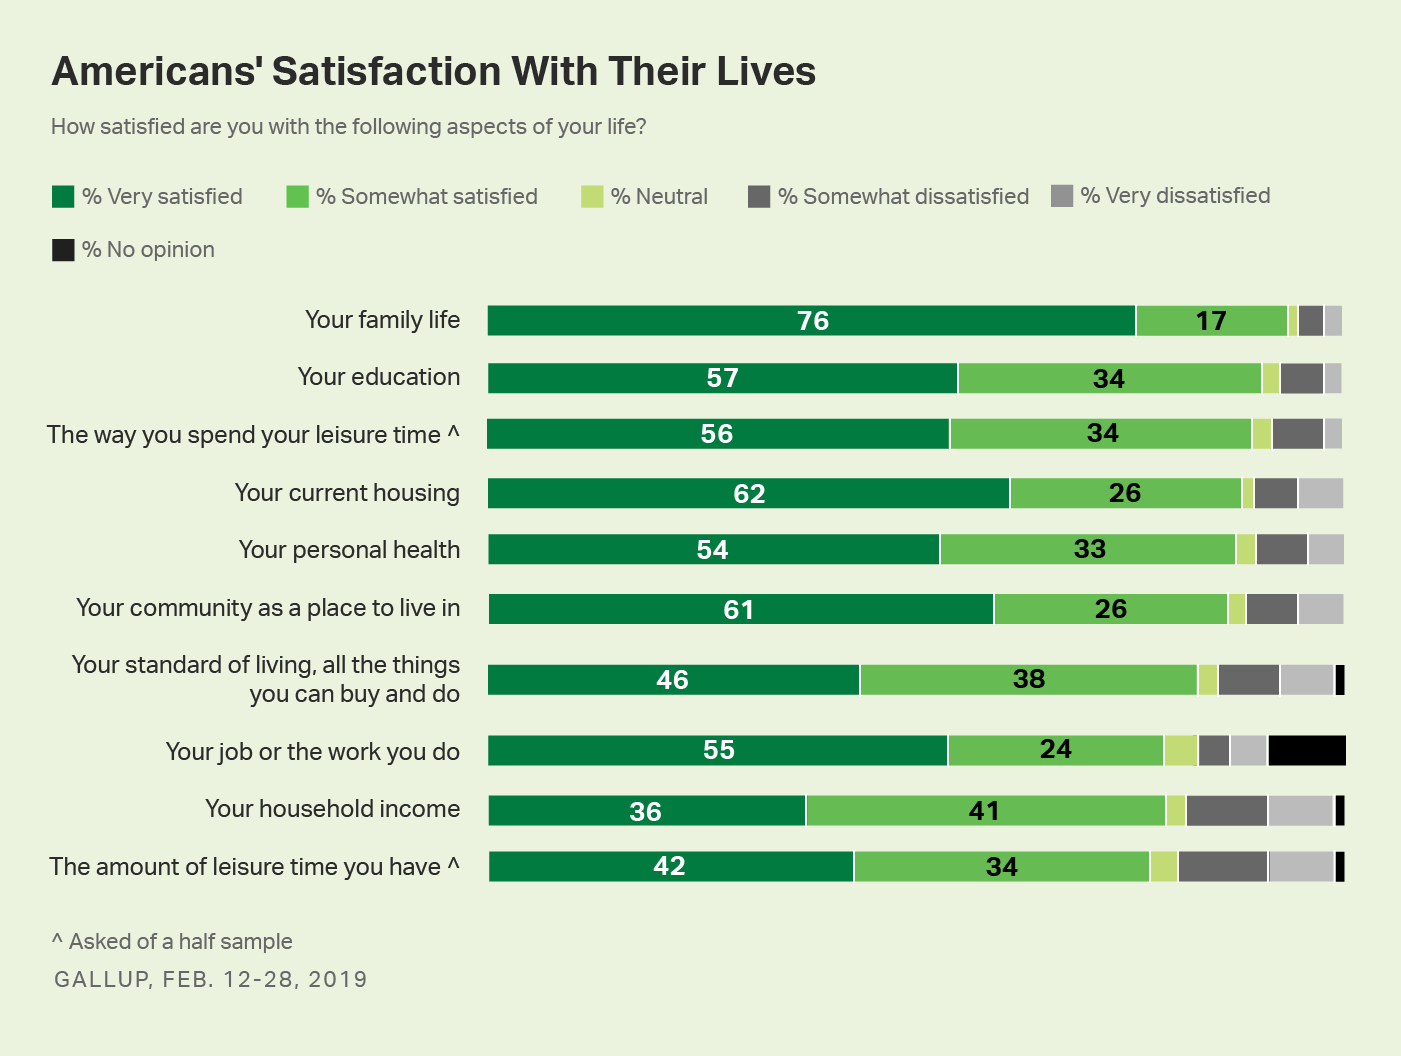
WASHINGTON, D.C. -- Americans are largely satisfied with 10 life aspects related to their finances, lifestyle, opportunities and social life. At least 90% of U.S. adults say they are "very" or "somewhat" satisfied with their family life, their education and the way they spend their leisure time. Likewise, at least 76% are satisfied with their housing, personal health, community, standard of living, job, household income and the amount of leisure time they have.
A Gallup poll in January found that Americans have a similarly sanguine attitude about their personal lives in general, while this latest measure, asked in a Feb. 12-28 poll, goes a step further in exploring satisfaction across a range of specific areas of their lives. This is the second time Gallup has measured the public's satisfaction with these specific facets. The previous survey, in 1995, found lower levels of satisfaction across most life aspects, but the results are not comparable because of differences in the content of the two surveys.
Looking just at the highest satisfaction level (those who are "very" satisfied), Americans' family lives (76%), housing (62%) and communities (61%) top the list, while household income (36%), the amount of leisure time they have (42%) and standard of living (46%) are at the bottom. Majorities ranging from 54% to 57% are very satisfied with their personal health, job, education and the way they spend their leisure time.
There are also notable differences in the highest level of satisfaction across each of the life attributes by race, age, education, household income, marital status and whether they have children younger than 18. Although majorities of each of these demographic groups report overall satisfaction ("very" and "somewhat" combined) with each of the 10 life aspects measured, there are some significant divergences in the percentages of those who are "very satisfied."
Household Income, Housing and Standard of Living
The largest disparities in high satisfaction levels among the major demographic groups are seen on household income, housing and standard of living. Americans with higher-income levels are more satisfied than their counterparts with each of these aspects of their lives. The same is true of older Americans, whites and those who are married. All of these categories -- race, age and marital status -- are closely tied to income level.
| Your household income | Your standard of living | Your current housing | ||||||||||||||||||||||||||||||||||||||||||||||||||||||||||||||||||||||||||||||||||||||||||||||||||
|---|---|---|---|---|---|---|---|---|---|---|---|---|---|---|---|---|---|---|---|---|---|---|---|---|---|---|---|---|---|---|---|---|---|---|---|---|---|---|---|---|---|---|---|---|---|---|---|---|---|---|---|---|---|---|---|---|---|---|---|---|---|---|---|---|---|---|---|---|---|---|---|---|---|---|---|---|---|---|---|---|---|---|---|---|---|---|---|---|---|---|---|---|---|---|---|---|---|---|---|---|
| % | % | % | ||||||||||||||||||||||||||||||||||||||||||||||||||||||||||||||||||||||||||||||||||||||||||||||||||
| Income | ||||||||||||||||||||||||||||||||||||||||||||||||||||||||||||||||||||||||||||||||||||||||||||||||||||
| Less than $40,000 | 11 | 25 | 45 | |||||||||||||||||||||||||||||||||||||||||||||||||||||||||||||||||||||||||||||||||||||||||||||||||
| $40,000-$99,999 | 35 | 46 | 65 | |||||||||||||||||||||||||||||||||||||||||||||||||||||||||||||||||||||||||||||||||||||||||||||||||
| $100,000 or more | 63 | 69 | 80 | |||||||||||||||||||||||||||||||||||||||||||||||||||||||||||||||||||||||||||||||||||||||||||||||||
| Race/Ethnicity | ||||||||||||||||||||||||||||||||||||||||||||||||||||||||||||||||||||||||||||||||||||||||||||||||||||
| Non-Hispanic white | 41 | 50 | 68 | |||||||||||||||||||||||||||||||||||||||||||||||||||||||||||||||||||||||||||||||||||||||||||||||||
| Non-Hispanic black | 28 | 35 | 57 | |||||||||||||||||||||||||||||||||||||||||||||||||||||||||||||||||||||||||||||||||||||||||||||||||
| Hispanic | 25 | 36 | 48 | |||||||||||||||||||||||||||||||||||||||||||||||||||||||||||||||||||||||||||||||||||||||||||||||||
| Age | ||||||||||||||||||||||||||||||||||||||||||||||||||||||||||||||||||||||||||||||||||||||||||||||||||||
| 18-29 | 26 | 41 | 43 | |||||||||||||||||||||||||||||||||||||||||||||||||||||||||||||||||||||||||||||||||||||||||||||||||
| 30-49 | 33 | 43 | 59 | |||||||||||||||||||||||||||||||||||||||||||||||||||||||||||||||||||||||||||||||||||||||||||||||||
| 50-64 | 37 | 44 | 70 | |||||||||||||||||||||||||||||||||||||||||||||||||||||||||||||||||||||||||||||||||||||||||||||||||
| 65+ | 45 | 58 | 77 | |||||||||||||||||||||||||||||||||||||||||||||||||||||||||||||||||||||||||||||||||||||||||||||||||
| Marital status | ||||||||||||||||||||||||||||||||||||||||||||||||||||||||||||||||||||||||||||||||||||||||||||||||||||
| Married | 46 | 54 | 73 | |||||||||||||||||||||||||||||||||||||||||||||||||||||||||||||||||||||||||||||||||||||||||||||||||
| Not married | 24 | 37 | 50 | |||||||||||||||||||||||||||||||||||||||||||||||||||||||||||||||||||||||||||||||||||||||||||||||||
| Gallup, Feb. 12-28, 2019 | ||||||||||||||||||||||||||||||||||||||||||||||||||||||||||||||||||||||||||||||||||||||||||||||||||||
Family Life, Community and Personal Health
Americans' satisfaction with several other aspects of their lifestyles -- family life, community as a place to live and personal health -- diverge by income level and show some differences by marital status and age. Upper-income Americans report greater satisfaction than those with lower incomes on all of these life aspects.
Married Americans are more satisfied with both their family lives and their communities than are those who are unmarried. Yet there is no difference between married and unmarried adults' satisfaction with their health. Older Americans are more likely than other age groups to be satisfied with their communities as a place to live, but younger Americans are more likely to be satisfied with their health.
| Family life | Community as a place to live | Personal health | ||||||||||||||||||||||||||||||||||||||||||||||||||||||||||||||||||||||||||||||||||||||||||||||||||
|---|---|---|---|---|---|---|---|---|---|---|---|---|---|---|---|---|---|---|---|---|---|---|---|---|---|---|---|---|---|---|---|---|---|---|---|---|---|---|---|---|---|---|---|---|---|---|---|---|---|---|---|---|---|---|---|---|---|---|---|---|---|---|---|---|---|---|---|---|---|---|---|---|---|---|---|---|---|---|---|---|---|---|---|---|---|---|---|---|---|---|---|---|---|---|---|---|---|---|---|---|
| % | % | % | ||||||||||||||||||||||||||||||||||||||||||||||||||||||||||||||||||||||||||||||||||||||||||||||||||
| Income | ||||||||||||||||||||||||||||||||||||||||||||||||||||||||||||||||||||||||||||||||||||||||||||||||||||
| Less than $40,000 | 66 | 52 | 45 | |||||||||||||||||||||||||||||||||||||||||||||||||||||||||||||||||||||||||||||||||||||||||||||||||
| $40,000-$99,999 | 80 | 61 | 55 | |||||||||||||||||||||||||||||||||||||||||||||||||||||||||||||||||||||||||||||||||||||||||||||||||
| $100,000 or more | 84 | 71 | 62 | |||||||||||||||||||||||||||||||||||||||||||||||||||||||||||||||||||||||||||||||||||||||||||||||||
| Age | ||||||||||||||||||||||||||||||||||||||||||||||||||||||||||||||||||||||||||||||||||||||||||||||||||||
| 18-29 | 72 | 53 | 61 | |||||||||||||||||||||||||||||||||||||||||||||||||||||||||||||||||||||||||||||||||||||||||||||||||
| 30-49 | 79 | 59 | 57 | |||||||||||||||||||||||||||||||||||||||||||||||||||||||||||||||||||||||||||||||||||||||||||||||||
| 50-64 | 76 | 60 | 47 | |||||||||||||||||||||||||||||||||||||||||||||||||||||||||||||||||||||||||||||||||||||||||||||||||
| 65+ | 77 | 71 | 52 | |||||||||||||||||||||||||||||||||||||||||||||||||||||||||||||||||||||||||||||||||||||||||||||||||
| Marital status | ||||||||||||||||||||||||||||||||||||||||||||||||||||||||||||||||||||||||||||||||||||||||||||||||||||
| Married | 88 | 68 | 55 | |||||||||||||||||||||||||||||||||||||||||||||||||||||||||||||||||||||||||||||||||||||||||||||||||
| Not married | 63 | 53 | 52 | |||||||||||||||||||||||||||||||||||||||||||||||||||||||||||||||||||||||||||||||||||||||||||||||||
| Gallup, Feb. 12-28, 2019 | ||||||||||||||||||||||||||||||||||||||||||||||||||||||||||||||||||||||||||||||||||||||||||||||||||||
Education and Job
Americans' satisfaction with their education and their job or the work they do varies based on their income, race and education. College graduates are much more satisfied with their own education than those without a college degree, but both groups are about equally satisfied with their jobs. Those with higher incomes are more satisfied with their education and jobs than those earning less. White and black Americans are significantly more satisfied than Hispanics with their education, but whites and Hispanics are more satisfied than blacks with their jobs.
| Your education | Your job or the work you do | |||||||||||||||||||||||||||||||||||||||||||||||||||||||||||||||||||||||||||||||||||||||||||||||||||
|---|---|---|---|---|---|---|---|---|---|---|---|---|---|---|---|---|---|---|---|---|---|---|---|---|---|---|---|---|---|---|---|---|---|---|---|---|---|---|---|---|---|---|---|---|---|---|---|---|---|---|---|---|---|---|---|---|---|---|---|---|---|---|---|---|---|---|---|---|---|---|---|---|---|---|---|---|---|---|---|---|---|---|---|---|---|---|---|---|---|---|---|---|---|---|---|---|---|---|---|---|
| % | % | |||||||||||||||||||||||||||||||||||||||||||||||||||||||||||||||||||||||||||||||||||||||||||||||||||
| Education | ||||||||||||||||||||||||||||||||||||||||||||||||||||||||||||||||||||||||||||||||||||||||||||||||||||
| Not college grad | 45 | 54 | ||||||||||||||||||||||||||||||||||||||||||||||||||||||||||||||||||||||||||||||||||||||||||||||||||
| College grad | 81 | 57 | ||||||||||||||||||||||||||||||||||||||||||||||||||||||||||||||||||||||||||||||||||||||||||||||||||
| Income | ||||||||||||||||||||||||||||||||||||||||||||||||||||||||||||||||||||||||||||||||||||||||||||||||||||
| Less than $40,000 | 44 | 40 | ||||||||||||||||||||||||||||||||||||||||||||||||||||||||||||||||||||||||||||||||||||||||||||||||||
| $40,000-$99,999 | 58 | 58 | ||||||||||||||||||||||||||||||||||||||||||||||||||||||||||||||||||||||||||||||||||||||||||||||||||
| $100,000 or more | 71 | 69 | ||||||||||||||||||||||||||||||||||||||||||||||||||||||||||||||||||||||||||||||||||||||||||||||||||
| Race/Ethnicity | ||||||||||||||||||||||||||||||||||||||||||||||||||||||||||||||||||||||||||||||||||||||||||||||||||||
| Non-Hispanic white | 60 | 57 | ||||||||||||||||||||||||||||||||||||||||||||||||||||||||||||||||||||||||||||||||||||||||||||||||||
| Non-Hispanic black | 59 | 46 | ||||||||||||||||||||||||||||||||||||||||||||||||||||||||||||||||||||||||||||||||||||||||||||||||||
| Hispanic | 46 | 56 | ||||||||||||||||||||||||||||||||||||||||||||||||||||||||||||||||||||||||||||||||||||||||||||||||||
| Gallup, Feb. 12-28, 2019 | ||||||||||||||||||||||||||||||||||||||||||||||||||||||||||||||||||||||||||||||||||||||||||||||||||||
Leisure Time
Older Americans are more likely to be retired, and accordingly are more satisfied with the amount of leisure time they have and the way they spend that time. Likewise, those who are married are more satisfied than unmarried people with their leisure time and activities. Americans who do not have children younger than 18 are also more satisfied with both aspects of leisure time than are those who have minor children.
| Amount of leisure time you have | The way you spend your leisure time | |||||||||||||||||||||||||||||||||||||||||||||||||||||||||||||||||||||||||||||||||||||||||||||||||||
|---|---|---|---|---|---|---|---|---|---|---|---|---|---|---|---|---|---|---|---|---|---|---|---|---|---|---|---|---|---|---|---|---|---|---|---|---|---|---|---|---|---|---|---|---|---|---|---|---|---|---|---|---|---|---|---|---|---|---|---|---|---|---|---|---|---|---|---|---|---|---|---|---|---|---|---|---|---|---|---|---|---|---|---|---|---|---|---|---|---|---|---|---|---|---|---|---|---|---|---|---|
| % | % | |||||||||||||||||||||||||||||||||||||||||||||||||||||||||||||||||||||||||||||||||||||||||||||||||||
| Age | ||||||||||||||||||||||||||||||||||||||||||||||||||||||||||||||||||||||||||||||||||||||||||||||||||||
| 18-29 | 29 | 49 | ||||||||||||||||||||||||||||||||||||||||||||||||||||||||||||||||||||||||||||||||||||||||||||||||||
| 30-49 | 33 | 55 | ||||||||||||||||||||||||||||||||||||||||||||||||||||||||||||||||||||||||||||||||||||||||||||||||||
| 50-64 | 37 | 52 | ||||||||||||||||||||||||||||||||||||||||||||||||||||||||||||||||||||||||||||||||||||||||||||||||||
| 65+ | 73 | 67 | ||||||||||||||||||||||||||||||||||||||||||||||||||||||||||||||||||||||||||||||||||||||||||||||||||
| Marital status | ||||||||||||||||||||||||||||||||||||||||||||||||||||||||||||||||||||||||||||||||||||||||||||||||||||
| Married | 47 | 62 | ||||||||||||||||||||||||||||||||||||||||||||||||||||||||||||||||||||||||||||||||||||||||||||||||||
| Not married | 37 | 49 | ||||||||||||||||||||||||||||||||||||||||||||||||||||||||||||||||||||||||||||||||||||||||||||||||||
| Parents | ||||||||||||||||||||||||||||||||||||||||||||||||||||||||||||||||||||||||||||||||||||||||||||||||||||
| Children under 18 | 29 | 49 | ||||||||||||||||||||||||||||||||||||||||||||||||||||||||||||||||||||||||||||||||||||||||||||||||||
| No children under 18 | 48 | 58 | ||||||||||||||||||||||||||||||||||||||||||||||||||||||||||||||||||||||||||||||||||||||||||||||||||
| Data for both readings are based on half samples | ||||||||||||||||||||||||||||||||||||||||||||||||||||||||||||||||||||||||||||||||||||||||||||||||||||
| Gallup, Feb. 12-28, 2019 | ||||||||||||||||||||||||||||||||||||||||||||||||||||||||||||||||||||||||||||||||||||||||||||||||||||
Bottom Line
Recent Gallup polling on Americans' satisfaction with 10 aspects of their lives paints a picture of a public that is broadly content with their family lives, their education and their leisure activities. Yet, some Americans are more satisfied than others. The greatest demographic disparities in high satisfaction levels across all areas measured are on household income, housing and standard of living, but differences exist for all of them.
Americans' income levels have more of an effect on satisfaction with all life aspects than any of the other major demographic categories. Those with higher household incomes are more satisfied with their income, jobs, standard of living, education, health, family life, housing and communities than are lower-income adults. The biggest differences between the two groups' satisfaction levels are on income, standard of living and housing. There are, however, smaller gaps in satisfaction between those from upper- and those from lower-income groups on personal health, family life and community.
View complete question responses and trends.
Learn more about how the Gallup Poll Social Series works.