GALLUP NEWS SERVICE
PRINCETON, NJ -- Americans' basic assessment of the national economy continues to be more negative than positive; however, that appraisal turned a bit brighter in the past month. Gallup's latest monthly measure of consumer spirits, conducted Oct. 9-12, shows improvement over September in Americans' perceptions of current economic conditions as well as in their outlook for the U.S. economy. At the same time, perceptions of the job market remained flat, suggesting the basis for consumers' newfound optimism lies in something other than the employment picture.
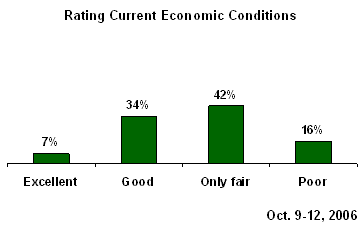
According to the new survey, 41% of Americans now choose the positive categories of "excellent" or "good" when given four options for rating current economic conditions. The majority (58%) choose one of the two more negative categories, calling the economy "only fair" or "poor."
The October poll was conducted during a record-setting week in the U.S. stock market, in which the Dow Jones Industrial Average flirted with the 12,000 mark. Public awareness that the Dow hit several record highs the week before seemed evident in the finding from Gallup's Oct. 6-8 poll that a 54% majority of Americans -- the highest number in more than two years -- believe it is a good idea to invest in the stock market now. (See Related Items.) This could also be filtering into Americans' basic economic evaluations.
Gas prices are another factor possibly influencing how Americans feel about the economy. Last month, the percentage mentioning energy costs as the nation's "most important problem" dropped to 5%, from 15% in August. This month, only 2% mention gas prices.
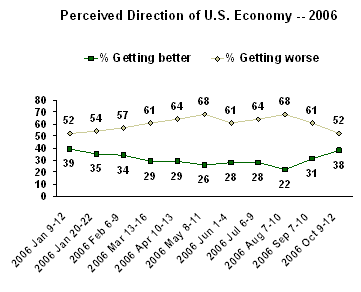
Corresponding with the decline in mentions of energy prices as the nation's top problem, Gallup's September poll recorded a sharp improvement in Americans' previously dismal forecast for the economy. The percentage saying the economy is "getting better" rose from 22% in August to 31% in September. The October poll builds on this gain, with 38% of Americans now perceiving that economic conditions in the country as a whole are improving.
This restores consumer confidence about the economy's direction to where it was in early January of this year. Still, this indicator has not yet turned the corner to a net positive outlook: a 52% majority continues to believe the economy is "getting worse." The greatest optimism Gallup has recorded on this measure came in January 2000, when 69% said the economy was getting better and only 23% said it was getting worse.
Currently, 40% of Americans believe now is a good time to find a quality job, while 54% call it a bad time. This is essentially unchanged from September, and is similar to attitudes throughout 2006.
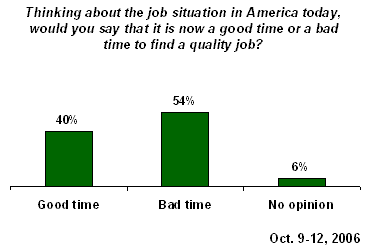
On a relative basis, perceptions of the job market have been a bright spot in consumer attitudes all year. Prior to October, the percentage saying, "it is now a good time to find a quality job" has averaged 41% in 2006, and has varied in only a narrow range between 40% and 42%. By contrast, the percentage calling economic conditions excellent or good averaged 36% from January through September 2006. Across the same period, an average of just 30% perceived the economy to be getting better.
With the latest surge in fundamental consumer sentiments, all three measures are now about on par with each other.
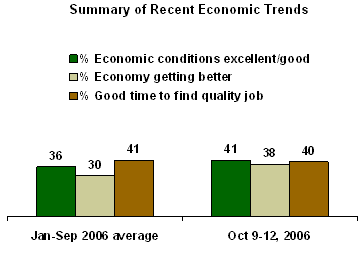
These findings in respondents' explicit ratings of the economy are confirmed by their responses to Gallup's open-ended question asking them to name the most important problem facing the country today. The latest poll records a decline in the percentage of Americans mentioning any economic issue as the nation's most important problem, from 26% in September to 19% now.
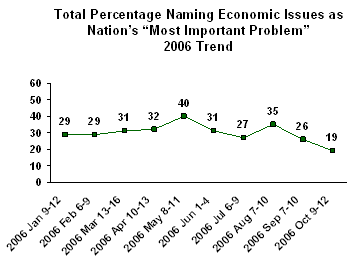
Part of this decline is explained by the drop in mentions of energy as a specific concern; the rest is because of a drop in the percentage saying the economy, generally, is a concern. Today's 19% mentioning any economic issue is the lowest Gallup has seen since 1999. Gallup has asked the "most important problem" question monthly since early 2001, and on a frequent basis before that since 1939.
Optimism Rises Across the Board
Increased confidence in the economy, as evidenced by the percentage saying the economy is "getting better," is seen across society. Overall, this sentiment nearly doubled between August and October (from 22% to 38%), and increases of similar proportions are seen among most groups within the categories of gender, region of the country, household income, and political party identification.
|
Percentage Saying U.S. Economy is "Getting Better" |
|||
|
August |
September |
October |
|
|
% |
% |
% |
|
|
National adults |
22 |
31 |
38 |
|
|
|
|
|
|
Men |
27 |
36 |
44 |
|
Women |
18 |
27 |
32 |
|
|
|
|
|
|
East |
17 |
28 |
33 |
|
Midwest |
20 |
25 |
35 |
|
South |
27 |
39 |
40 |
|
West |
22 |
29 |
41 |
|
|
|
|
|
|
$75,000+ |
27 |
35 |
43 |
|
$30,000-$74,999 |
23 |
31 |
36 |
|
Less than $30,000 |
14 |
19 |
31 |
|
|
|
|
|
|
Republican |
43 |
57 |
67 |
|
Independent |
15 |
28 |
32 |
|
Democrat |
10 |
13 |
19 |
Survey Methods
These results are based on telephone interviews with a randomly selected national sample of 1,001 adults, aged 18 and older, conducted Oct. 9-12, 2006. For results based on this sample, one can say with 95% confidence that the maximum error attributable to sampling and other random effects is ±3 percentage points. In addition to sampling error, question wording and practical difficulties in conducting surveys can introduce error or bias into the findings of public opinion polls.
Now turning to the economy,
5. How would you rate economic conditions in this country today -- as excellent, good, only fair, or poor?
|
|
Excellent |
Good |
Only |
Poor |
No |
|
2006 |
% |
% |
% |
% |
% |
|
2006 Oct 9-12 |
7 |
34 |
42 |
16 |
1 |
|
|
|
|
|
|
|
|
2006 Sep 7-10 |
5 |
29 |
44 |
22 |
1 |
|
2006 Aug 7-10 |
5 |
31 |
43 |
21 |
* |
|
2006 Jul 6-9 |
5 |
33 |
42 |
19 |
1 |
|
2006 Jun 1-4 |
6 |
30 |
46 |
18 |
* |
|
2006 May 8-11 |
4 |
25 |
45 |
25 |
* |
|
2006 Apr 10-13 |
5 |
33 |
40 |
23 |
-- |
|
2006 Mar 13-16 |
4 |
30 |
45 |
20 |
1 |
|
2006 Feb 6-9 |
4 |
34 |
42 |
20 |
* |
|
2006 Jan 20-22 |
5 |
34 |
41 |
18 |
1 |
|
2006 Jan 9-12 |
8 |
35 |
37 |
18 |
1 |
|
2005 |
|
|
|
|
|
|
2005 Dec 19-22 |
6 |
33 |
39 |
22 |
* |
|
2005 Dec 5-8 |
6 |
31 |
43 |
20 |
* |
|
2005 Nov 17-20 |
5 |
32 |
39 |
24 |
* |
|
2005 Nov 7-10 |
3 |
29 |
47 |
21 |
* |
|
2005 Oct 24-26 |
3 |
26 |
45 |
25 |
1 |
|
2005 Oct 13-16 |
3 |
25 |
46 |
26 |
* |
|
2005 Sep 26-28 |
3 |
28 |
41 |
27 |
1 |
|
2005 Sep 12-15 |
3 |
28 |
44 |
25 |
* |
|
2005 Aug 22-25 |
4 |
30 |
42 |
24 |
* |
|
2005 Aug 8-11 |
4 |
32 |
46 |
18 |
* |
|
2005 Jul 25-28 |
4 |
28 |
44 |
23 |
1 |
|
2005 Jul 7-10 |
3 |
33 |
45 |
18 |
1 |
|
2005 Jun 16-19 |
4 |
33 |
40 |
23 |
* |
|
2005 Jun 6-8 |
4 |
31 |
45 |
20 |
* |
|
2005 May 23-26 |
3 |
37 |
41 |
19 |
* |
|
2005 May 2-5 |
1 |
30 |
44 |
25 |
* |
|
2005 Apr 18-21 |
2 |
29 |
44 |
24 |
1 |
|
2005 Apr 4-7 |
3 |
29 |
49 |
18 |
1 |
|
2005 Mar 21-23 |
2 |
30 |
43 |
24 |
1 |
|
2005 Mar 7-10 |
3 |
32 |
48 |
16 |
1 |
|
2005 Feb 21-24 |
5 |
33 |
42 |
20 |
* |
|
2005 Feb 7-10 |
3 |
37 |
44 |
16 |
* |
|
2005 Jan 3-5 |
3 |
38 |
42 |
17 |
* |
|
|
Excellent |
Good |
Only |
Poor |
No |
|
2004 |
% |
% |
% |
% |
% |
|
2004 Dec 5-8 |
2 |
35 |
43 |
19 |
1 |
|
2004 Nov 7-10 |
3 |
33 |
44 |
20 |
* |
|
2004 Oct 11-14 |
2 |
32 |
44 |
22 |
* |
|
2004 Oct 9-10 |
4 |
31 |
40 |
24 |
1 |
|
2004 Sep 13-15 |
3 |
36 |
39 |
22 |
* |
|
2004 Aug 9-11 |
3 |
36 |
40 |
21 |
* |
|
2004 Jul 30-Aug 1 |
6 |
32 |
39 |
23 |
* |
|
2004 Jul 8-11 |
5 |
32 |
41 |
21 |
1 |
|
2004 Jun 3-6 |
3 |
32 |
44 |
21 |
* |
|
2004 May 2-4 |
2 |
27 |
43 |
27 |
1 |
|
2004 Apr 5-8 |
3 |
31 |
44 |
22 |
* |
|
2004 Mar 8-11 |
2 |
30 |
44 |
24 |
* |
|
2004 Feb 9-12 |
2 |
31 |
46 |
21 |
-- |
|
2004 Jan 12-15 |
3 |
34 |
42 |
21 |
-- |
|
2004 Jan 2-5 |
3 |
40 |
41 |
16 |
* |
|
2003 |
|
|
|
|
|
|
2003 Dec 11-14 |
3 |
34 |
44 |
19 |
* |
|
2003 Nov 3-5 |
2 |
28 |
49 |
21 |
* |
|
2003 Oct 24-26 |
2 |
24 |
44 |
30 |
* |
|
2003 Oct 6-8 |
2 |
20 |
50 |
27 |
1 |
|
2003 Sep 8-10 |
1 |
20 |
49 |
30 |
* |
|
2003 Aug 4-6 |
1 |
24 |
52 |
23 |
* |
|
2003 Jul 7-9 |
1 |
23 |
50 |
26 |
* |
|
2003 Jun 12-15 |
1 |
25 |
49 |
25 |
* |
|
2003 May 19-21 |
1 |
20 |
47 |
31 |
1 |
|
2003 May 5-7 |
1 |
21 |
50 |
28 |
* |
|
2003 Apr 7-9 |
2 |
25 |
51 |
22 |
* |
|
2003 Mar 29-30 |
1 |
25 |
51 |
23 |
* |
|
2003 Mar 24-25 |
3 |
30 |
47 |
20 |
-- |
|
2003 Mar 3-5 |
1 |
21 |
46 |
32 |
* |
|
2003 Feb 17-19 |
1 |
17 |
48 |
34 |
* |
|
2003 Feb 3-6 |
2 |
20 |
53 |
25 |
* |
|
2003 Jan 20-22 |
1 |
19 |
49 |
31 |
* |
|
2003 Jan 13-16 |
2 |
20 |
50 |
28 |
* |
|
2002 |
|
|
|
|
|
|
2002 Dec 19-22 |
1 |
23 |
48 |
28 |
* |
|
2002 Dec 5-8 |
2 |
23 |
51 |
24 |
* |
|
2002 Nov 22-24 |
2 |
30 |
45 |
23 |
* |
|
2002 Oct 31-Nov 3 |
2 |
26 |
45 |
26 |
1 |
|
2002 Oct 3-6 |
2 |
24 |
46 |
27 |
1 |
|
2002 Sep 23-26 |
2 |
25 |
47 |
25 |
1 |
|
2002 Sep 5-8 |
2 |
22 |
53 |
23 |
* |
|
2002 Aug 19-21 |
1 |
23 |
47 |
28 |
1 |
|
2002 Aug 5-8 |
1 |
27 |
52 |
19 |
1 |
|
2002 Jul 29-31 |
2 |
27 |
48 |
22 |
1 |
|
2002 Jul 22-24 |
2 |
25 |
48 |
24 |
1 |
|
2002 Jul 9-11 |
2 |
26 |
51 |
20 |
1 |
|
2002 Jun 17-19 |
2 |
35 |
43 |
19 |
1 |
|
2002 Jun 3-6 |
3 |
33 |
49 |
14 |
1 |
|
2002 May 20-22 |
3 |
38 |
46 |
12 |
1 |
|
2002 May 6-9 |
2 |
33 |
51 |
14 |
* |
|
2002 Apr 22-24 |
2 |
37 |
46 |
14 |
1 |
|
2002 Apr 8-11 |
2 |
36 |
51 |
11 |
* |
|
2002 Mar 4-7 |
3 |
31 |
51 |
14 |
1 |
|
2002 Feb 4-6 |
2 |
26 |
55 |
16 |
1 |
|
2002 Jan 7-9 |
2 |
27 |
54 |
16 |
1 |
|
|
Excellent |
Good |
Only |
Poor |
No |
|
2001 |
% |
% |
% |
% |
% |
|
2001 Dec 6-9 |
2 |
29 |
53 |
16 |
* |
|
2001 Nov 8-11 |
2 |
29 |
50 |
19 |
* |
|
2001 Oct 11-14 |
2 |
36 |
48 |
13 |
1 |
|
2001 Sep 14-15 |
3 |
43 |
44 |
9 |
1 |
|
2001 Sep 7-10 |
2 |
30 |
49 |
19 |
* |
|
2001 Aug 16-19 |
2 |
34 |
49 |
14 |
1 |
|
2001 Jul 19-22 |
3 |
38 |
47 |
11 |
1 |
|
2001 Jun 11-17 |
3 |
39 |
45 |
12 |
1 |
|
2001 May 10-14 |
3 |
37 |
45 |
15 |
* |
|
2001 Apr 6-8 |
4 |
41 |
41 |
14 |
* |
|
2001 Mar 5-7 |
3 |
43 |
43 |
10 |
1 |
|
2001 Feb 1-4 |
7 |
44 |
36 |
13 |
* |
|
2001 Jan 10-14 |
11 |
56 |
27 |
6 |
* |
|
2000 |
|
|
|
|
|
|
2000 Dec 2-4 |
12 |
51 |
28 |
8 |
1 |
|
2000 Nov 13-15 |
19 |
53 |
21 |
7 |
* |
|
2000 Oct 6-9 |
14 |
57 |
24 |
4 |
1 |
|
2000 Aug 18-19 |
25 |
49 |
21 |
4 |
1 |
|
2000 Jul 25-26 |
26 |
48 |
21 |
4 |
1 |
|
2000 May 18-21 |
17 |
49 |
24 |
9 |
1 |
|
2000 Apr 3-9 |
14 |
46 |
30 |
9 |
1 |
|
2000 Jan 7-10 |
19 |
52 |
23 |
5 |
1 |
|
1999 |
|
|
|
|
|
|
1999 Oct 21-24 |
16 |
49 |
27 |
8 |
* |
|
1999 Sep 10-14 |
20 |
47 |
24 |
8 |
1 |
|
1999 Aug 24-26 |
14 |
50 |
28 |
7 |
1 |
|
1999 Jun 4-5 |
18 |
56 |
21 |
5 |
* |
|
1999 Jan 15-17 |
14 |
55 |
27 |
4 |
* |
|
1998 |
|
|
|
|
|
|
1998 Dec 4-6 |
13 |
52 |
27 |
8 |
* |
|
1998 Oct 29-Nov 1 |
13 |
53 |
27 |
6 |
1 |
|
1998 Sep 1 |
11 |
54 |
25 |
9 |
1 |
|
1998 Mar 20-22 |
20 |
46 |
27 |
7 |
* |
|
1997 |
|
|
|
|
|
|
1997 Dec 18-21 |
7 |
41 |
38 |
12 |
2 |
|
1997 Nov 6-9 |
10 |
48 |
33 |
9 |
* |
|
1997 Aug 22-25^ |
8 |
41 |
38 |
13 |
* |
|
1997 May 6-7 |
7 |
39 |
38 |
15 |
1 |
|
1997 Jan 31-Feb 2 |
4 |
38 |
43 |
15 |
* |
|
1996 |
|
|
|
|
|
|
1996 Oct 26-29 |
5 |
42 |
39 |
13 |
1 |
|
1996 Aug 30-Sep 1 † |
3 |
34 |
46 |
16 |
1 |
|
1996 Jul 18-21 |
5 |
38 |
43 |
14 |
* |
|
1996 May 9-12 |
3 |
27 |
50 |
19 |
1 |
|
1996 Apr 9-10 |
1 |
26 |
52 |
20 |
1 |
|
1996 Mar 15-17 |
2 |
31 |
48 |
18 |
1 |
|
1996 Jan 5-7 |
1 |
28 |
47 |
23 |
1 |
|
1995 |
|
|
|
|
|
|
1995 Nov 6-8 |
2 |
28 |
47 |
22 |
1 |
|
1995 May 11-14 |
2 |
27 |
50 |
20 |
1 |
|
1994 |
|
|
|
|
|
|
1994 Dec 16-18 |
2 |
25 |
52 |
21 |
* |
|
1994 Nov 2-6 |
2 |
28 |
49 |
20 |
1 |
|
1994 Oct 22-25 |
1 |
25 |
52 |
21 |
1 |
|
1994 Jul 15-17 |
1 |
26 |
52 |
21 |
* |
|
1994 Apr 22-24 |
1 |
23 |
49 |
26 |
1 |
|
1994 Jan 15-17 |
* |
22 |
54 |
24 |
* |
|
1993 |
|
|
|
|
|
|
1993 Dec 4-6 |
1 |
20 |
57 |
21 |
1 |
|
1993 Nov 2-4 |
1 |
16 |
50 |
33 |
* |
|
1993 Aug 8-10 |
* |
10 |
49 |
40 |
1 |
|
1993 Jun 29-30 |
1 |
14 |
52 |
32 |
1 |
|
1993 Feb 12-14 |
* |
14 |
46 |
39 |
1 |
|
1992 |
|
|
|
|
|
|
1992 Dec 18-20 |
2 |
16 |
34 |
47 |
1 |
|
1992 Dec 4-6 |
1 |
14 |
41 |
43 |
1 |
|
1992 Oct 23-25 |
* |
11 |
45 |
43 |
1 |
|
1992 Sep 11-15 |
1 |
10 |
37 |
51 |
1 |
|
1992 Aug 31-Sep 2 † |
1 |
9 |
37 |
53 |
* |
|
1992 Jun 12-14 † |
1 |
11 |
47 |
41 |
* |
|
1992 Apr 9-12 † |
1 |
11 |
40 |
48 |
* |
|
1992 Jan 3-6 |
* |
12 |
46 |
41 |
1 |
|
† Asked of registered voters |
|||||
|
* Less than 0.5% |
|||||
6. Right now, do you think that economic conditions in the country as a whole are getting better or getting worse?
|
|
Getting |
Getting |
SAME |
No |
|
2006 |
% |
% |
% |
% |
|
2006 Oct 9-12 |
38 |
52 |
7 |
3 |
|
|
|
|
|
|
|
2006 Sep 7-10 |
31 |
61 |
6 |
2 |
|
2006 Aug 7-10 |
22 |
68 |
8 |
2 |
|
2006 Jul 6-9 |
28 |
64 |
7 |
2 |
|
2006 Jun 1-4 |
28 |
61 |
9 |
3 |
|
2006 May 8-11 |
26 |
68 |
4 |
2 |
|
2006 Apr 10-13 |
29 |
64 |
5 |
2 |
|
2006 Mar 13-16 |
29 |
61 |
8 |
2 |
|
2006 Feb 6-9 |
34 |
57 |
7 |
3 |
|
2006 Jan 20-22 |
35 |
54 |
7 |
3 |
|
2006 Jan 9-12 |
39 |
52 |
7 |
2 |
|
2005 |
|
|
|
|
|
2005 Dec 19-22 |
37 |
56 |
5 |
2 |
|
2005 Dec 5-8 |
39 |
50 |
8 |
3 |
|
2005 Nov 17-20 |
36 |
58 |
5 |
1 |
|
2005 Nov 7-10 |
30 |
61 |
7 |
2 |
|
2005 Oct 24-26 |
25 |
66 |
7 |
2 |
|
2005 Oct 13-16 |
24 |
68 |
6 |
2 |
|
2005 Sep 26-28 |
24 |
66 |
7 |
3 |
|
2005 Sep 12-15 |
25 |
66 |
7 |
2 |
|
2005 Aug 22-25 |
28 |
63 |
7 |
2 |
|
2005 Aug 8-11 |
36 |
52 |
9 |
3 |
|
2005 Jul 25-28 |
35 |
53 |
9 |
3 |
|
2005 Jul 7-10 |
35 |
54 |
8 |
3 |
|
2005 Jun 16-19 |
35 |
57 |
6 |
2 |
|
2005 Jun 6-8 |
35 |
55 |
8 |
2 |
|
2005 May 23-26 |
41 |
52 |
5 |
2 |
|
2005 May 2-5 |
32 |
61 |
6 |
1 |
|
2005 Apr 18-21 |
31 |
61 |
5 |
3 |
|
2005 Apr 4-7 |
35 |
56 |
6 |
3 |
|
2005 Mar 21-23 |
33 |
59 |
6 |
2 |
|
2005 Mar 7-10 |
41 |
50 |
6 |
3 |
|
2005 Feb 21-24 |
43 |
48 |
7 |
2 |
|
2005 Feb 7-10 |
47 |
44 |
7 |
2 |
|
2005 Jan 3-5 |
48 |
42 |
7 |
3 |
|
|
Getting |
Getting |
SAME |
No |
|
2004 |
% |
% |
% |
% |
|
2004 Dec 5-8 |
47 |
42 |
8 |
3 |
|
2004 Nov 7-10 |
49 |
43 |
6 |
2 |
|
2004 Oct 11-14 |
39 |
50 |
8 |
3 |
|
2004 Oct 9-10 |
43 |
48 |
7 |
2 |
|
2004 Sep 13-15 |
47 |
45 |
6 |
2 |
|
2004 Aug 9-11 |
45 |
46 |
7 |
2 |
|
2004 Jul 30-Aug 1 |
48 |
43 |
7 |
2 |
|
2004 Jul 8-11 |
51 |
38 |
7 |
4 |
|
2004 Jun 3-6 |
47 |
45 |
6 |
2 |
|
2004 May 2-4 |
43 |
51 |
4 |
2 |
|
2004 Apr 5-8 |
47 |
45 |
6 |
2 |
|
2004 Mar 8-11 |
44 |
47 |
7 |
2 |
|
2004 Feb 9-12 |
53 |
40 |
6 |
1 |
|
2004 Jan 12-15 |
53 |
39 |
6 |
2 |
|
2004 Jan 2-5 |
66 |
27 |
4 |
3 |
|
2003 |
|
|
|
|
|
2003 Dec 11-14 |
60 |
32 |
7 |
1 |
|
2003 Nov 3-5 |
53 |
37 |
8 |
2 |
|
2003 Oct 24-26 |
47 |
43 |
8 |
2 |
|
2003 Oct 6-8 |
45 |
46 |
7 |
2 |
|
2003 Sep 8-10 |
40 |
50 |
8 |
2 |
|
2003 Aug 4-6 |
44 |
45 |
9 |
2 |
|
2003 Jul 7-9 |
43 |
47 |
8 |
2 |
|
2003 Jun 12-15 |
45 |
43 |
10 |
2 |
|
2003 May 19-21 |
40 |
48 |
10 |
2 |
|
2003 May 5-7 |
42 |
51 |
5 |
2 |
|
2003 Apr 7-9 |
36 |
51 |
11 |
2 |
|
2003 Mar 29-30 |
33 |
56 |
9 |
2 |
|
2003 Mar 24-25 |
39 |
47 |
11 |
3 |
|
2003 Mar 3-5 |
23 |
67 |
7 |
3 |
|
2003 Feb 17-19 |
26 |
63 |
9 |
2 |
|
2003 Feb 3-6 |
27 |
60 |
11 |
2 |
|
2003 Jan 20-22 |
29 |
57 |
12 |
2 |
|
2003 Jan 13-16 |
34 |
54 |
10 |
2 |
|
2002 |
|
|
|
|
|
2002 Dec 19-22 |
35 |
50 |
12 |
3 |
|
2002 Dec 5-8 |
35 |
54 |
8 |
3 |
|
2002 Nov 22-24 |
38 |
53 |
8 |
1 |
|
2002 Oct 31-Nov 3 |
37 |
51 |
8 |
4 |
|
2002 Oct 3-6 |
30 |
59 |
8 |
3 |
|
2002 Sep 23-26 |
33 |
52 |
10 |
5 |
|
2002 Sep 5-8 |
35 |
54 |
9 |
2 |
|
2002 Aug 19-21 |
38 |
48 |
10 |
4 |
|
2002 Aug 5-8 |
32 |
55 |
9 |
4 |
|
2002 Jul 29-31 |
42 |
47 |
8 |
3 |
|
2002 Jul 22-24 |
27 |
59 |
10 |
4 |
|
2002 Jul 9-11 |
31 |
57 |
10 |
2 |
|
2002 Jun 17-19 |
47 |
40 |
10 |
3 |
|
2002 Jun 3-6 |
48 |
38 |
11 |
3 |
|
2002 May 20-22 |
49 |
34 |
14 |
3 |
|
2002 May 6-9 |
52 |
39 |
7 |
2 |
|
2002 Apr 22-24 |
53 |
35 |
10 |
2 |
|
2002 Apr 8-11 |
53 |
37 |
7 |
3 |
|
2002 Mar 4-7 |
54 |
37 |
7 |
2 |
|
2002 Feb 4-6 |
41 |
47 |
10 |
2 |
|
2002 Jan 7-9 |
49 |
41 |
8 |
2 |
|
|
Getting |
Getting |
SAME |
No |
|
2001 |
% |
% |
% |
% |
|
2001 Dec 6-9 |
44 |
48 |
6 |
2 |
|
2001 Nov 8-11 |
30 |
59 |
7 |
4 |
|
2001 Oct 11-14 |
33 |
55 |
10 |
2 |
|
2001 Sep 14-15 |
28 |
60 |
8 |
4 |
|
2001 Sep 7-10 |
19 |
70 |
9 |
2 |
|
2001 Aug 16-19 |
27 |
59 |
11 |
3 |
|
2001 Jul 19-22 |
35 |
53 |
9 |
3 |
|
2001 Jun 11-17 |
29 |
60 |
8 |
3 |
|
2001 May 10-14 |
25 |
63 |
9 |
3 |
|
2001 Apr 6-8 |
24 |
63 |
9 |
4 |
|
2001 Mar 5-7 |
28 |
61 |
7 |
4 |
|
2001 Feb 1-4 |
23 |
66 |
8 |
3 |
|
2001 Jan 10-14 |
32 |
56 |
8 |
4 |
|
2000 |
|
|
|
|
|
2000 Dec 2-4 |
39 |
48 |
8 |
5 |
|
2000 Nov 13-15 |
50 |
38 |
9 |
3 |
|
2000 Oct 6-9 |
54 |
34 |
10 |
2 |
|
2000 Aug 18-19 |
60 |
26 |
10 |
4 |
|
2000 Jul 25-26 |
58 |
29 |
9 |
4 |
|
2000 May 18-21 |
52 |
37 |
9 |
2 |
|
2000 Jan 7-10 |
69 |
23 |
6 |
2 |
|
1999 |
|
|
|
|
|
1999 Oct 21-24 |
52 |
34 |
11 |
3 |
|
1999 Sep 10-14 |
59 |
29 |
9 |
3 |
|
1999 Aug 24-26 |
54 |
31 |
12 |
3 |
|
1999 Jun 4-5 |
60 |
27 |
9 |
4 |
|
1999 Jan 15-17 |
63 |
28 |
6 |
3 |
|
1998 |
|
|
|
|
|
1998 Dec 4-6 |
52 |
38 |
8 |
2 |
|
1998 Oct 29-Nov 1 |
51 |
38 |
8 |
3 |
|
1998 Sep 1 |
45 |
41 |
11 |
3 |
|
1997 |
|
|
|
|
|
1997 Dec 18-21 |
49 |
39 |
8 |
4 |
|
1997 Nov 6-9 |
51 |
37 |
9 |
3 |
|
1997 May 6-7 |
50 |
40 |
7 |
3 |
|
1997 Jan 31-Feb 2 |
46 |
39 |
12 |
3 |
|
1996 |
|
|
|
|
|
1996 Oct 26-29 |
50 |
38 |
7 |
5 |
|
1996 Aug 30-Sep 1 † |
52 |
37 |
8 |
3 |
|
1996 Jul 18-21 |
43 |
46 |
9 |
2 |
|
1996 May 9-12 |
39 |
49 |
9 |
3 |
|
1992 |
|
|
|
|
|
1992 Aug 31-Sep 2 † |
29 |
59 |
10 |
2 |
|
1992 Aug 10-12 † |
24 |
65 |
10 |
1 |
|
1992 Jun 12-14 † |
28 |
61 |
9 |
2 |
|
1992 Apr 9-12 † |
40 |
45 |
13 |
2 |
|
1992 Mar 20-22 † |
37 |
51 |
11 |
1 |
|
1992 Jan 31-Feb 1 † |
22 |
70 |
7 |
1 |
|
1992 Jan 3-6 |
22 |
71 |
6 |
1 |
|
1991 |
|
|
|
|
|
1991 Dec 5-8 |
19 |
69 |
9 |
3 |
|
1991 Sep 5-8 |
27 |
60 |
10 |
3 |
|
1991 Jul 11-14 |
34 |
51 |
9 |
6 |
|
(vol.) = Volunteered response |
||||
|
† Asked of registered voters |
||||
