GALLUP NEWS SERVICE
PRINCETON, NJ -- Although Americans are not highly positive about the condition of the current job market, they have become more so than they were in late 2002 and early 2003. This increase in optimism about jobs has occurred selectively, with the largest increases occurring among Republicans and those with high household incomes. Democrats and Americans living in lower-income households are only marginally more positive now than they were in late 2002 and early 2003.
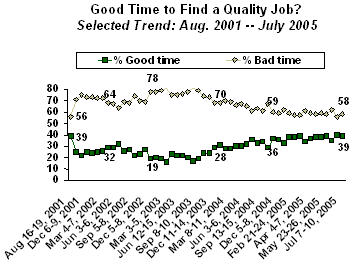
Gallup began asking Americans a basic job market question -- "Thinking about the job situation in America today, would you say that it is now a good time or a bad time to find a quality job?" -- on a monthly basis beginning in August 2001.
Thirty-nine percent of Americans said that it was a good time to find a quality job in that August 2001 poll, the exact same percentage as recorded in Gallup's July 7-10, 2005 poll. This question's similar starting and ending points mask the fact, however, that there has been a good deal of change during the intervening four years.
Americans became steadily more negative about finding quality jobs in 2001 and 2002, reaching a low point in March 2003 when only 16% said that it was a good time to find a quality job. In August 2003, only 17% agreed it was a good time to find a quality job.
Positive perceptions of the job market began to climb modestly after that point, reaching 31% in January 2004, 37% in November 2004, and 40% in June 2005 (and 39%, as noted, in Gallup's early July poll).
Thus, the public's view of the job market reached a 4-year low in late 2002 and early 2003, while positive perceptions have increased in recent months and now equal the 4-year high in August 2001.
(Polling done by the University of Connecticut suggests that responses to this same "quality job" question were much more positive in the late 1990s and in 2000 -- at the tail end of the dot-com boom.)
Who Has Become More Positive?
A special Gallup analysis of 4,006 interviews conducted from December 2002 through March 2003, when the percent agreeing that it was a good time to find a quality job was 18%, shows that almost all key subgroups were relatively negative about the job market. In other words, there is relatively little difference among key subgroups.
|
Perceptions of the Job Market |
|||
|
Good time |
Bad time |
Don't know |
|
|
% |
% |
% |
|
|
Total |
18 |
79 |
3 |
|
Republican |
25 |
71 |
4 |
|
Independent |
16 |
82 |
2 |
|
Democrat |
14 |
84 |
2 |
|
18- to 29-years-old |
24 |
75 |
1 |
|
30- to 39-years-old |
21 |
77 |
2 |
|
40- to 49-years-old |
19 |
80 |
1 |
|
50- to 59-years-old |
16 |
82 |
2 |
|
60- to 69-years-old |
14 |
83 |
3 |
|
70 years old or older |
12 |
82 |
6 |
|
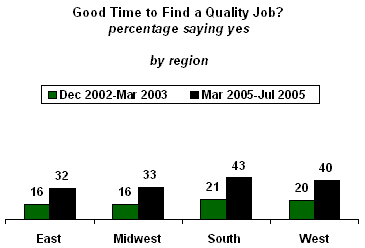
East |
16 |
82 |
2 |
|
Midwest |
16 |
81 |
3 |
|
South |
21 |
77 |
2 |
|
West |
20 |
76 |
3 |
|
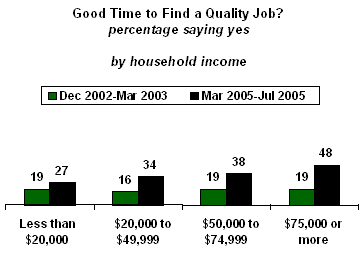
Less than $20,000 |
19 |
79 |
2 |
|
$20,000-$29,000 |
15 |
82 |
3 |
|
$30,000-$49,000 |
18 |
79 |
2 |
|
$50,000-$74,999 |
19 |
79 |
2 |
|
$75,000+ |
19 |
79 |
2 |
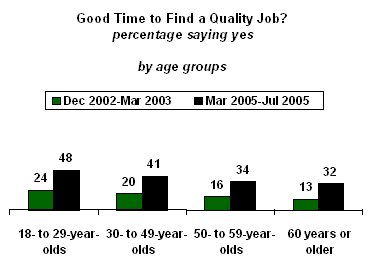
Republicans and 18- to 29-year-olds are slightly more likely than others to respond affirmatively to the "good job" question during this time period, but generally there is remarkably little variation across subgroups.
The results from December 2002 through March 2003 can be compared to a combined sample of 8,037 interviews conducted from March 2005 through July 2005. The overall percentage agreeing that it is a good time to find a quality job in this aggregated sample is 37%. The percentage of those who agreed that it was a good time to find a quality job essentially doubled from an average of 18% from late 2002-early 2003 to 37% during the last several months.
But there is now significant variation across subgroups in agreement with this question.
|
Perceptions of the Job Market |
|||
|
Good time |
Bad time |
Don't know |
|
|
% |
% |
% |
|
|
Total |
37 |
59 |
4 |
|
Republican |
59 |
37 |
4 |
|
Independent |
33 |
63 |
4 |
|
Democrat |
21 |
77 |
2 |
|
18- to 29-years-old |
42 |
56 |
2 |
|
30- to 39-years-old |
44 |
54 |
2 |
|
40- to 49-years-old |
38 |
59 |
3 |
|
50- to 59-years-old |
34 |
63 |
2 |
|
60- to 69-years-old |
33 |
62 |
5 |
|
70 years old or older |
31 |
60 |
8 |
|
East |
32 |
64 |
3 |
|
Midwest |
33 |
64 |
3 |
|
South |
43 |
53 |
4 |
|
West |
40 |
56 |
4 |
|
Less than $20,000 |
27 |
69 |
4 |
|
$20,000-$29,000 |
32 |
65 |
3 |
|
$30,000-$49,000 |
36 |
61 |
3 |
|
$50,000-$74,999 |
38 |
59 |
3 |
|
$75,000+ |
48 |
49 |
3 |
The change in perceptions of the job situation from late 2002-early 2003 to this year did not occur proportionately across the key demographic groups outlined above. Instead, the data show disproportionate increases among Republicans, those with higher household incomes, and to some degree those living in the South and West.
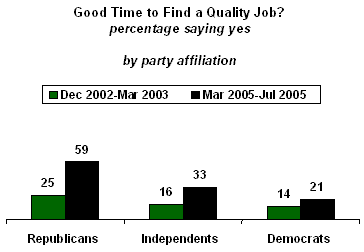
The Power of Party
The data show that Americans' partisan identification has become an increasingly important predictor of their views of the labor market -- much more so than just 1 or 2 years ago.
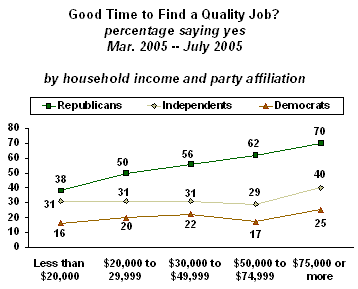
Regardless of income category, Republicans are more positive about the job market than are independents, who in turn are more positive than are Democrats. At the same time, there is a very strong effect of household income level among Republicans, such that positive views of the job market jump from 38% among the lowest income group to 70% among the highest.
The effect of income is much more muted among the other two political groups. Independents whose households make $75,000 a year or more are somewhat more positive than other independents. But among Democrats, household income makes very little difference at all. Democrats are quite negative about the job market regardless of their personal household income. In short, for Democrats, political party affiliation trumps income.
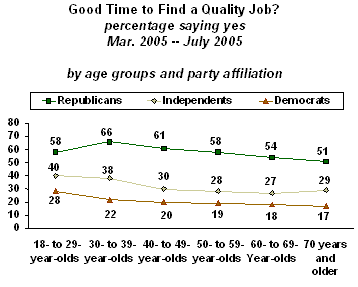
There is a decline in positive perceptions of the job market as age increases among all three political groups. Regardless of age, however, Republicans remain much more optimistic than either independents or Democrats.
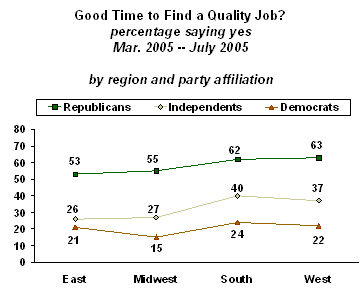
There is a slight tendency for those living in the South and West to be more positive about the job market than those living in the East and Midwest across the three political groups, but, again, Republicans are substantially more optimistic than are independents or Democrats regardless of region.
Survey Methods
These results are based on telephone interviews with randomly selected national samples of adults, aged 18 and older, conducted during the time periods noted above. The combined sample sizes are noted above as well. For results based on these samples, one can say with 95% confidence that the maximum error attributable to sampling and other random effects is ±2 percentage points or less. In addition to sampling error, question wording and practical difficulties in conducting surveys can introduce error or bias into the findings of public opinion polls.