First in a two-part series examining investor optimism in individual U.S. states
The U.S. Constitution ensures that every state has a voice in government. After all, no matter how rich or populous, each state gets but two senators. Nonetheless, some states are more economically important than others are. High population density means more investors, and investor optimism -- or lack of it -- in these large states may strongly influence America's short-term economic future.
This article explores the quarterly results of the 2002 Index of Investor Optimism -- U.S.* (a joint effort of UBS and Gallup) data in four key states in the West and Midwest**. Although investor optimism varied widely among these states in 2002, it is clear that investors in each of the four states were significantly less optimistic at the end of the fourth quarter than they were a year ago. The Personal Dimension refers to investors' views of their own situations and the Economic Dimension concerns investors' views of the economy in general. The overall Index of Investor Optimism -- U.S. blends the Personal and Economic Dimensions to chart a trajectory of optimism.
California
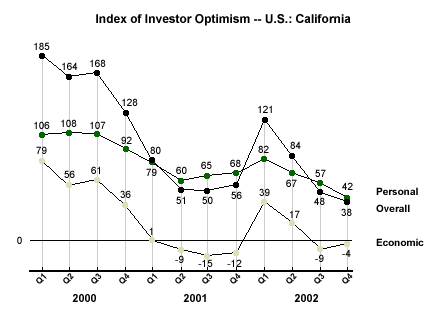
Investor optimism in the West at the end of the year was low, and California is a perfect illustration of this. California's overall Index started 2002 at a promising 121, fell to 84 in the second quarter, and dropped like a rock to 48 in the third. The deterioration didn't slow until the fourth quarter, when the Index hit 38 -- for an overall loss of 83 points.
Considered separately, the declines on the Personal and Economic Dimensions of the Index are much less dramatic. The Personal Dimension lost 40 points over the year -- going from 82 in the first quarter to 42 in the fourth. The Economic Dimension lost 44 points, starting the year at 39 and ending the year in negative territory at -4.

Michigan
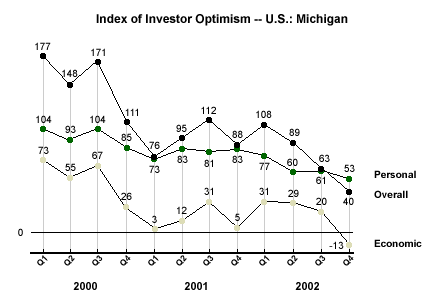
Investor optimism ended the year low in Michigan, although the change in Michigan during 2002 was less severe than the change in California.
Overall, the Index started the year at 108, then dropped to 89 in the second quarter, 63 in the third, and rounded out the fourth quarter at 40. This represents a 68-point loss in 2002. That drop can't be blamed on the Index's Personal Dimension, which lost a comparatively small 24 points during 2002, while the Economic Dimension lost 44 points, going from 31 to -13.

Illinois
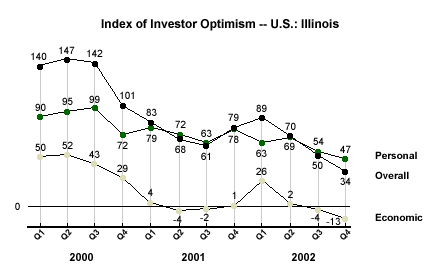
Illinois investors seemed composed, but not optimistic, in 2002. The overall Index started 2002 cautiously in Illinois at 89. It then slid to 70 in the second quarter, 50 in the third quarter, and 34 in the fourth -- for a total loss of 55 points.
Illinois' Personal Dimension lost a total 16 points in 2002, dropping from 63 in the first quarter to 47 in the fourth. Again, the anxiety among this state's investors shows most clearly in the Economic Dimension. Though the year showed only a 39-point loss, this dimension started low to begin with. In the first quarter, the Illinois Economic Dimension was a mere 26, and it wound up at -13 in the fourth quarter.

Ohio
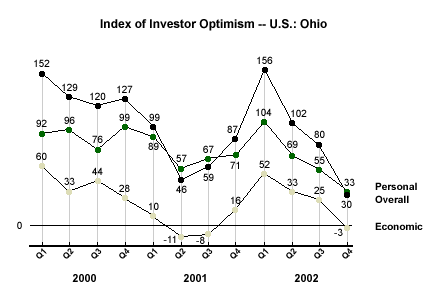
The year 2002 was an especially upsetting year for Ohio investors. They were among the most cheerful in the first quarter, and ended the year among the least optimistic. Overall, optimism was at a relatively sanguine 156 among Ohio investors, and then the Index dropped 54 points to 102 in the second quarter, fell to 80 in the third quarter, and then plunged another 50 points to 30 in the fourth. The overall loss was 126 points -- the largest in any of the key states.
Furthermore, Ohio's dizzying drop was unusual in that it can be largely attributed to disillusionment on the Personal Dimension, which dropped from 104 in the first quarter to 33 in the fourth. But while the Personal Dimension dropped the farthest fastest in Ohio, the Economic Dimension sunk the lowest, from 52 in the first quarter to -3 in the fourth quarter.

*Results for the Gallup/UBS Index of Investor Optimism -- U.S. are based on monthly interviews with about 1,000 U.S. investors, aged 18 and older. For results based on each of these samples, one can say with 95% confidence that the maximum error attributable to sampling and other random effects is ±3%. In addition to sampling error, question wording and practical difficulties in conducting surveys can introduce error or bias into the findings of public opinion polls.
**Gallup identifies these states as "East": Maine, New Hampshire, Vermont, Massachusetts, Rhode Island, Connecticut, New York, New Jersey, Pennsylvania, Maryland, Delaware, West Virginia, and the District of Columbia
Gallup identifies these states as "West": Montana, Arizona, Colorado, Idaho, Wyoming, Utah, Nevada, New Mexico, California, Oregon, and Washington
Gallup identifies these states as "South": Virginia, North Carolina, South Carolina, Georgia, Florida, Kentucky, Tennessee, Alabama, Mississippi, Arkansas, Louisiana, Oklahoma, and Texas
Gallup identifies these states as "Midwest": Ohio, Michigan, Indiana, Illinois, Wisconsin, Minnesota, Iowa, Missouri, North Dakota, South Dakota, Nebraska, and Kansas
