Many of us use ratings every day -- whether we're going online to give our dining experience five stars, selecting a smiley emoji to rate our shopping experience or checking to see if the repair service we're considering has an A+ Better Business Bureau rating.
Yet, most of these types of evaluations collect our opinions in a different way than traditional survey scales do, such as five-point agree/disagree scales. This evolution has led some survey sponsors and researchers to wonder whether traditional scales are dated and whether alternative measures that people use in everyday life can lead to a more enjoyable respondent experience and yield better-quality data.
To test this, Gallup conducted an experiment that compared the use of a traditional scale with the use of star, emoji and report card ratings.
The Experiment
Gallup completed 6,722 web surveys in April 2019 with individuals who had previously completed a Gallup dual-frame (mobile and landline) telephone survey and provided us with an email address and permission to recontact them for future surveys. We selected this group, rather than our Gallup Panel members, because individuals in the sample did not have set expectations for how a Gallup web survey should look and feel. Respondents on the sample frame were randomly assigned to one of eight treatment groups.
The survey asked respondents 36 questions about their satisfaction with government, institutions and infrastructure and then about President Donald Trump's handling of policy issues. Everyone in all treatments was asked the same survey questions, but the presentation of the response scale differed based on the assigned experimental condition.
The experiment had four scale type treatments (traditional, emoji, report card and star) crossed with two wording treatments (scale not defined vs. scale defined). A respondent was asked questions in the same format throughout the entire survey. For example, someone assigned to the emoji condition only saw emoji scales.
In the "scale defined" version of the experiment, each scale type was described in the question stem, telling people how to interpret the scale. In the "scale not defined" version of the experiment, these descriptors were left off, leaving the respondent to interpret the scale on their own.
The wordings for the "scale defined" and "scale not defined" groups were as follows.
Scale defined:
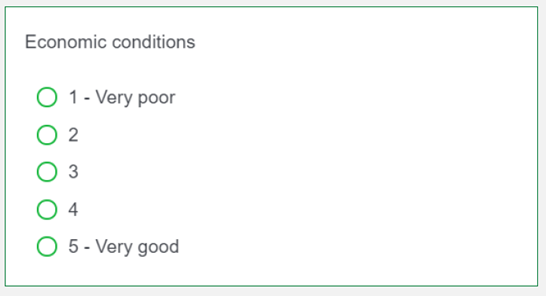
- Traditional: On a scale from 1 to 5, where 1 is very poor and 5 is very good, how would you rate the overall performance of each of the following government sectors and officials?
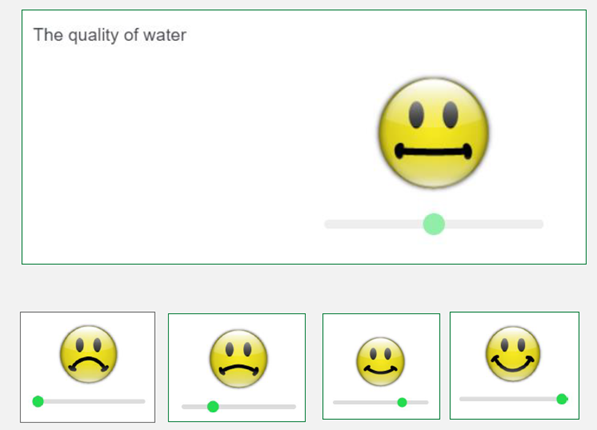
- Emoji: Using this emoji scale, which ranges from very poor to very good, how would you rate the overall performance of each of the following government sectors and officials?
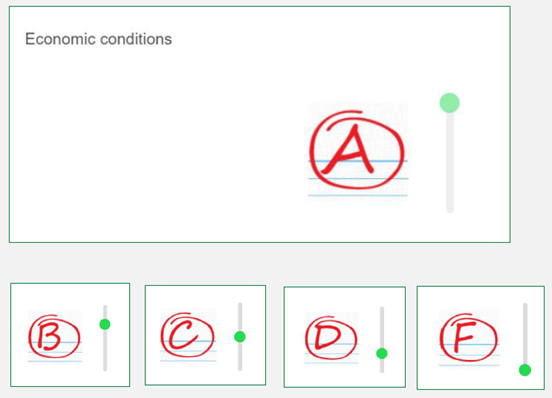
- Report card: On a report card, where A means very good and F means very poor, how would you rate the overall performance of each of the following government sectors and officials?
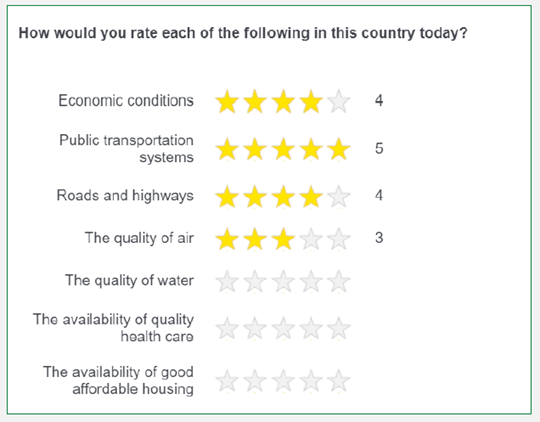
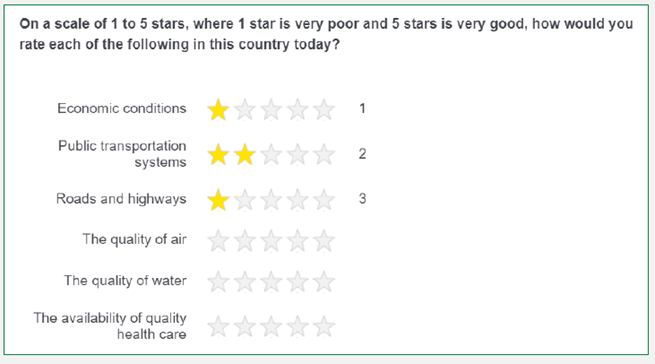
- Star: On a scale of 1 to 5 stars, where 1 star is very poor and 5 stars is very good, how would you rate the overall performance of each of the following government sectors and officials?
Scale not defined:
- All: How would you rate the overall performance of each of the following government sectors and officials?
The survey was programmed in Qualtrics (an online survey tool that Gallup and other organizations use to conduct web surveys), which offers each of these scale formats. The special scale types have set functionality in Qualtrics, and it was not possible to modify certain features to minimize potential differences between questions.
For example, the emoji and report card scales could only be presented with a slider, while the traditional scale used radio buttons and the star scale was displayed in a grid. Further, the slider on the report card displayed vertically, while the slider on the emoji displayed horizontally. While it would have been ideal to avoid these types of differences, we opted to implement them exactly as they were available to us.
These images show the difference between the scale defined and scale not defined wording treatments:

Results
The final response rate was 19.6% (AAPOR RR5), and there was no significant difference in response rate by treatment group. In other words, the nontraditional scale formats (emoji, star and report card) did not result in a higher response rate than the traditional scale format.
We observed significant differences in breakoff rates (respondents who start the survey but do not finish), with the highest breakoff rates from the report card groups (scale defined and scale not defined) and the scale defined emoji group. Interestingly, defining the scale did appear to affect breakoff rates, although the direction of the effect differed by scale type. Breakoffs for the star scale were higher when the scale was not defined, but breakoffs for the emoji scale were highest in the defined group. There were no differences in breakoffs between scale defined and scale not defined for the traditional scale or the report card scale.
There were also significant differences by treatment group in the number of questions with missing data (questions that were unanswered). The emoji and report card formats had significantly more missing questions (approximately five questions with missing data) than the star and traditional formats (less than one question with missing data).
We also looked at non-differentiation of responses. Non-differentiation is a measure of how variable responses are for an individual respondent across several questions. For example, if a respondent is asked 12 questions and they answer "5" to all 12 questions, this respondent did not differentiate any of their responses. Some amount of variability in responses is generally considered desirable and an indicator of attentive and thoughtful respondents.
We calculated a non-differentiation score for 12 community evaluation questions. These questions shared the same question stem and scale. Respondents using the defined emoji scale had the most differentiation in scores, while respondents using the not defined star scale had the least amount of differentiation. It is important to note that the star scale was displayed as a grid, while the other scales were not displayed this way. The grid format for the star scale (which could not be modified in the survey design) may have encouraged non-differentiation of responses.
Evaluation of Respondent Experience
At the end of the survey, respondents were asked to evaluate their interest in the survey on a five-point scale. Interestingly, there were no significant differences among treatment groups. However, this only accounts for respondents who completed the entire survey and not those who broke off (and presumably lacked interest or encountered difficulty finishing the survey). In other words, respondents who completed the survey using a more novel scale -- which some might hypothesize to be more fun or familiar -- reported no greater interest in the survey.
The same was true for interest in receiving future surveys. Nearly all respondents across all scale types reported interest in receiving future Gallup surveys. Again, this was among respondents who made it to the end of the survey and were asked this question.
Conclusions
Based on these findings, we found no evidence that nontraditional scale formats (at least as they were operationalized in this experiment) resulted in higher response rates or more engaged respondents, as compared with the traditional format.
To the contrary, the traditional format either resulted in quality measures that were as good as or superior to (in some instances) the alternative formats. This experiment did have a few important limitations. Results for some of the scales may be confounded with how they were displayed (sliders, grids, horizontal/vertical formatting) rather than the measures themselves. Additionally, the experiment was conducted using a topic that one may not think of in terms of smiley faces, report cards or stars.
Results may have differed with a different topic, such as a customer satisfaction survey. Still, the results of this experiment did not suggest that traditional scale formats are outdated or do not conform to respondent norms and expectations.
To stay up to date with the latest Gallup News insights and updates, follow us on Twitter.