PRINCETON, NJ -- Gallup's Job Creation Index in March showed the jobs picture within the federal government turning sharply negative to -9, with 25% of federal employees reporting that their employer was hiring and 34% saying their employer was letting people go. This marks a rapid deterioration from the +1 of February and +18 in April 2010.

Job conditions are now negative across all three levels of government. More state government employees report that their organizations are letting people go (32%) than hiring (19%), for an index score of -13. The same is true among local governments, with 20% hiring and 34% letting go, for an index score of −14.
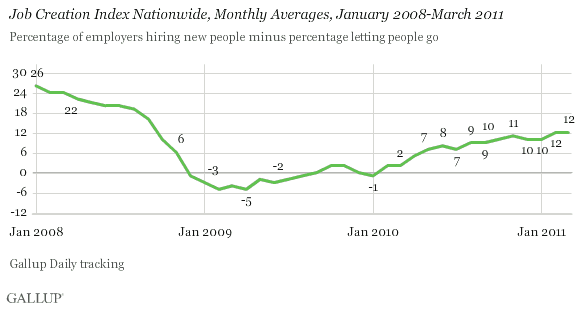
Job Creation Remains at a 2 ½-Year High
Despite the plunge in federal hiring, Gallup's Job Creation Index remained at its 2 ½-year high of +12 in March -- matching February. The index is now 10 points better than it was in March 2010.

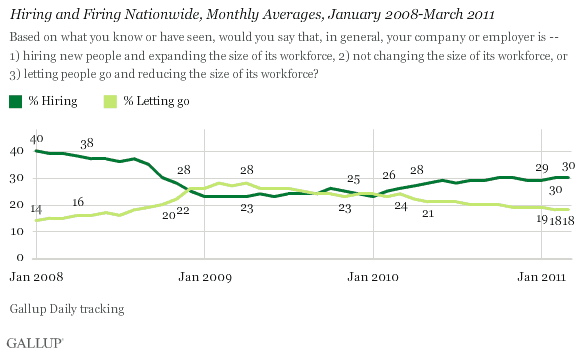
March's +12 index score is based on 30% of employees nationwide saying their employers are hiring and 18% saying their employers are letting workers go, also identical to February's numbers. This reflects a slight improvement from January and a major improvement from March of a year ago, when 26% of workers said their companies were hiring and 24% said theirs were letting workers go.
Job Market Conditions Improved in South and Midwest
Job market conditions were best in the South (+15) and the Midwest (+14), and worst in the West (+7). The West showed a slight dip in job creation from February to March, while the other regions were up slightly. The latest job numbers in the South are the best since September 2008.

Implications
Job market conditions were slightly better in February and March than in recent months. This is consistent with the improvement in jobless claims over the first quarter and the reported creation of 200,000+ jobs in each of those months.
The improvement in job conditions in the South and Midwest also aligns with surging oil and gas prices as well as other commodity prices. These regions tend to benefit disproportionately from these strong sectors of the economy. At the same time, the weakness in the West could be related to the continuing deterioration of housing market conditions.
The budget struggles of state and local governments are reflected in their weak job market conditions. Further, the deterioration in federal job market conditions likely reflects budget battles in the nation's capital.
The current level of job growth does not seem consistent with the way the government's unemployment rate has plunged by one full percentage point since November 2010. Normally, it takes about 150,000 to 200,000 new jobs monthly just to keep up with the growth in the U.S. workforce. With the increase of 200,000+ jobs in March, the unemployment rate fell from 8.9% to 8.8%, according to the government.
Gallup's unemployment and underemployment measures are declining modestly -- as might be expected, given spring seasonal hiring patterns. Part of the decline in Gallup's measures likely results from a decline in the percentage of Americans who are counted as being in the workforce. This suggests that potential workers continue to drop out of the workforce.
As such, the true improvement in the jobs market and the overall U.S. economy is likely more modest than the euphoria on Wall Street and in the nation's capital after last week's jobs report would imply. Private-sector job creation thus should remain a top national priority if the nation is going to avoid higher unemployment and underemployment levels in the months ahead.
Gallup.com reports results from these indexes in daily, weekly, and monthly averages and in Gallup.com stories. Complete trend data are always available to view and export in the following charts:
Daily: Employment, Economic Confidence and Job Creation, Consumer Spending
Weekly: Employment, Economic Confidence, Job Creation, Consumer Spending
Read more about Gallup's economic measures.
View our economic release schedule.
Survey Methods
For Gallup Daily tracking, Gallup interviews approximately 1,000 national adults, aged 18 and older, each day. The Gallup Job Creation Index results are based on a random sample of approximately 500 current full- and part-time employees each day.
National results for January are based on Gallup Daily tracking interviews with 16,900 employees conducted March 1-31, 2011. For this sample, one can say with 95% confidence that the maximum margin of sampling error is ±1 percentage point. Regional results for March are based on interviews totaling more than 3,000 in each region. For each total regional sample, the maximum margin of sampling error is ±3 percentage points.
Interviews are conducted with respondents on landline telephones and cellular phones, with interviews conducted in Spanish for respondents who are primarily Spanish-speaking. Each daily sample includes a minimum quota of 200 cell phone respondents and 800 landline respondents, with additional minimum quotas among landline respondents for gender within region. Landline respondents are chosen at random within each household on the basis of which member had the most recent birthday.
Samples are weighted by gender, age, race, Hispanic ethnicity, education, region, adults in the household, cell phone-only status, cell phone-mostly status, and phone lines. Demographic weighting targets are based on the March 2010 Current Population Survey figures for the aged 18 and older non-institutionalized population living in U.S. telephone households. All reported margins of sampling error include the computed design effects for weighting and sample design.
In addition to sampling error, question wording and practical difficulties in conducting surveys can introduce error or bias into the findings of public opinion polls.
For more details on Gallup's polling methodology, visit www.gallup.com.
