Story Highlights
- At 41%, Clinton's favorable rating is unchanged since before Election Day
- Her flat ratings buck the trend of post-election boost for losing candidates
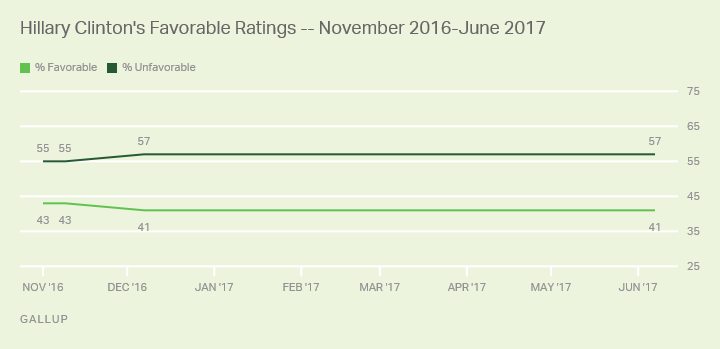
WASHINGTON, D.C. -- Americans are no more likely to view Hillary Clinton favorably than they were before last year's presidential election. Forty-one percent have a favorable view of the 2016 Democratic presidential candidate, within the 41% to 43% range Gallup has recorded since November.

The latest poll, conducted June 7-11, finds that a majority of Americans continue to view Clinton unfavorably (57%), as they have in all Gallup polls on the former first lady and U.S. senator since January 2016.
After retreating from public view following her loss in November, Clinton has re-emerged -- tweeting, speaking at a college graduation, and attending a Broadway musical where she and her husband received a standing ovation.
Some appearances by the two-time presidential candidate have not been as well-received, however. In an interview last month, Clinton blamed her election loss on various factors, including weak Democratic Party infrastructure, mishandlings of an investigation by former FBI Director James Comey and biased media coverage of her campaign. Though she claimed to "take responsibility for every decision" her campaign made, many viewed her comments as shirking blame for her loss.
Meanwhile, Clinton remains a target of President Donald Trump, who continues to tweet about her months after he defeated her in the election -- including last week, when he rehashed many of the criticisms lobbed at Clinton during the campaign.
Clinton's current favorable rating is just a few percentage points higher than her all-time low -- 38%, last recorded in late August/early September 2016. Gallup has measured Americans' opinions of Clinton since 1992, finding substantial variation over time. She received her highest favorable rating of 67% in December 1998 while serving as first lady, just after the House of Representatives voted to impeach her husband, President Bill Clinton. She also received two 66% ratings in 2011 and 2012 during her tenure as secretary of state.
Losing Candidates Usually Regain Stature After the Election -- but Not Clinton
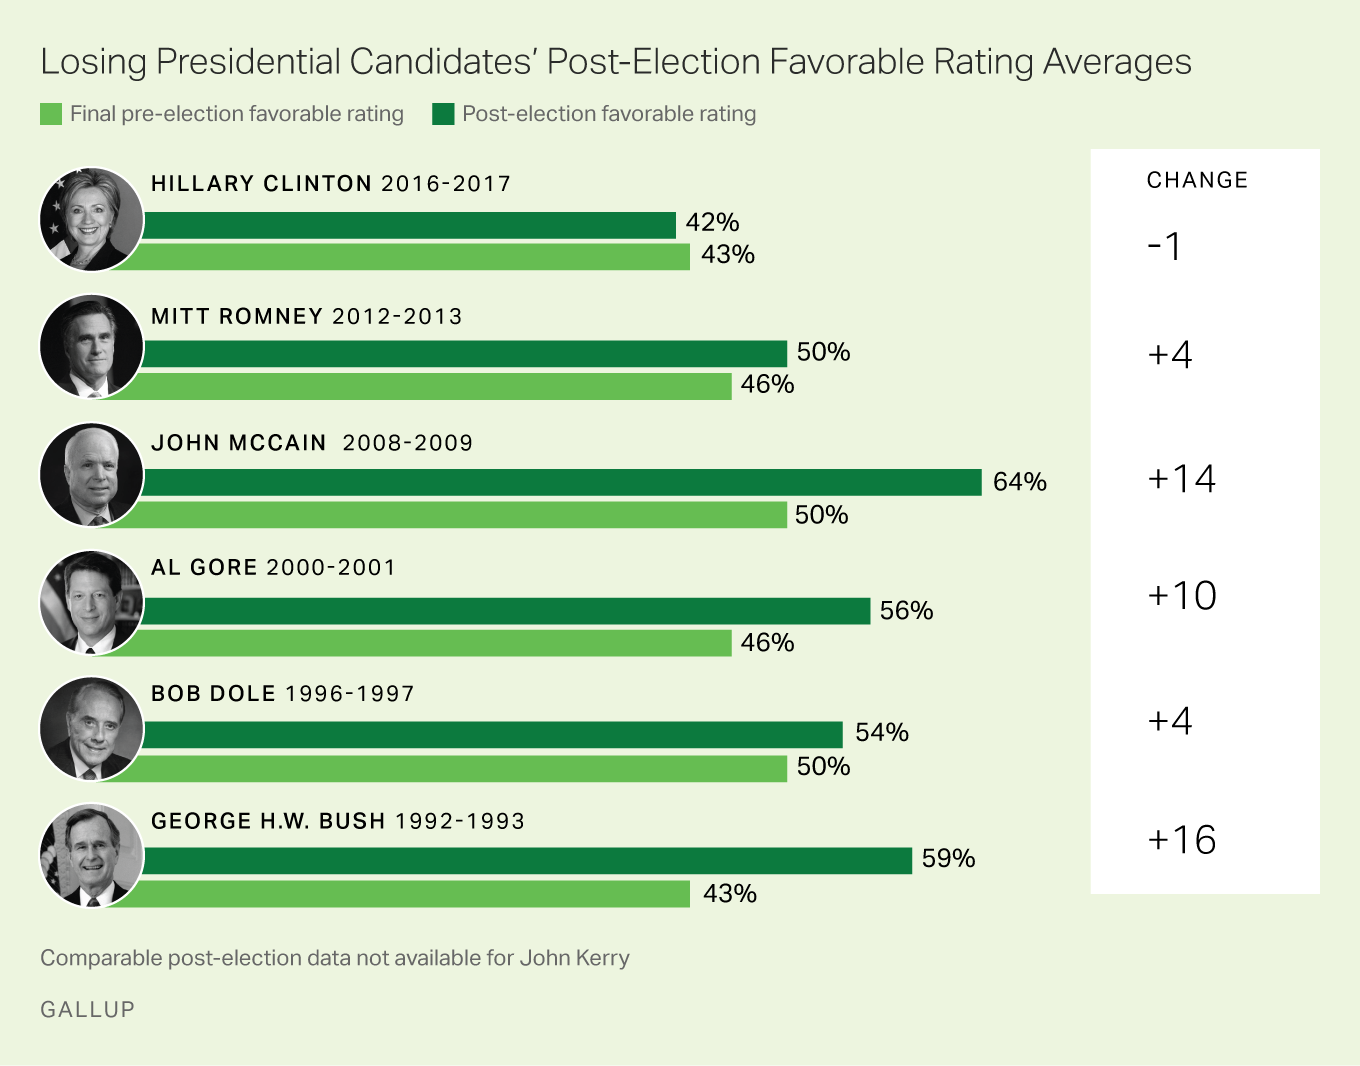
Over the past quarter century, the favorable ratings of losing presidential candidates generally have increased after the election -- some in the immediate aftermath and others in the months that followed. With the exception of John Kerry, for whom there are no comparable data, losing presidential candidates since 1992 have experienced a boost of at least four percentage points in favorability when averaging their ratings from the day after the election through the following June.
While some increases have been modest, such as Mitt Romney's and Bob Dole's four-point improvements, others have been much larger, such as George H.W. Bush's 16-point and John McCain's 14-point gains in favorability.
But for Clinton, this has not been the case. Seven months after her failed bid for the presidency, she remains as unpopular now as she was then.

Typically, losing candidates' favorable ratings improve because political independents and supporters of the opposing political party grow to view the candidate more positively after the election. However, this has not happened for Clinton. Her current ratings among Republicans (11%) and independents (33%) are just as low now as last November before she lost to Trump. Democrats maintain a mostly positive view of Clinton, with 79% viewing her favorably.
Bottom Line
November's election was unlike any other before it, with both major party candidates having some of the lowest favorable ratings of any candidates in Gallup's history. This situation has had unique consequences for the losing candidate as well as the winner.
Seven months after her loss, Clinton's image remains near its record low since 1992 -- even though prior losing candidates' images improved after their defeats. Trump, like previous winners, did get an increase in favorability shortly after his win, though his current 40% favorable rating remains low in an absolute sense.
Some former Clinton supporters have been openly resentful of the failed candidate, calling her toxic and divisive, and unhelpful in any efforts to resist Trump and his agenda. Republicans, meanwhile, haven't softened to Clinton in the way they did to Gore after his 2000 loss, or the way Democrats did to Romney and McCain. To some degree, that may be an outcome of the increasingly partisan political environment, but it may also reflect Republicans' long-held and deep-seated antipathy toward Clinton.
At this point, then, it is unclear when or if Clinton's image will recover. Americans have liked Clinton most when her role was less political -- such as secretary of state or first lady weathering her husband's public scandal -- and her ratings have suffered each time she has run for office. If she doesn't seek to run again, her favorability is far less relevant and frees her from the constraints of public opinion.
| Favorable | Unfavorable | No opinion | ||||||||||||||||||||||||||||||||||||||||||||||||||||||||||||||||||||||||||||||||||||||||||||||||||
|---|---|---|---|---|---|---|---|---|---|---|---|---|---|---|---|---|---|---|---|---|---|---|---|---|---|---|---|---|---|---|---|---|---|---|---|---|---|---|---|---|---|---|---|---|---|---|---|---|---|---|---|---|---|---|---|---|---|---|---|---|---|---|---|---|---|---|---|---|---|---|---|---|---|---|---|---|---|---|---|---|---|---|---|---|---|---|---|---|---|---|---|---|---|---|---|---|---|---|---|---|
| % | % | % | ||||||||||||||||||||||||||||||||||||||||||||||||||||||||||||||||||||||||||||||||||||||||||||||||||
| Hillary Clinton | ||||||||||||||||||||||||||||||||||||||||||||||||||||||||||||||||||||||||||||||||||||||||||||||||||||
| Jun 7, 2017 | 41 | 57 | 2 | |||||||||||||||||||||||||||||||||||||||||||||||||||||||||||||||||||||||||||||||||||||||||||||||||
| Dec 7, 2016 | 41 | 57 | 2 | |||||||||||||||||||||||||||||||||||||||||||||||||||||||||||||||||||||||||||||||||||||||||||||||||
| Nov 9, 2016 | 43 | 55 | 2 | |||||||||||||||||||||||||||||||||||||||||||||||||||||||||||||||||||||||||||||||||||||||||||||||||
| Mitt Romney | ||||||||||||||||||||||||||||||||||||||||||||||||||||||||||||||||||||||||||||||||||||||||||||||||||||
| Nov 9, 2012 | 50 | 45 | 5 | |||||||||||||||||||||||||||||||||||||||||||||||||||||||||||||||||||||||||||||||||||||||||||||||||
| John McCain | ||||||||||||||||||||||||||||||||||||||||||||||||||||||||||||||||||||||||||||||||||||||||||||||||||||
| Nov 7, 2008 | 64 | 33 | 3 | |||||||||||||||||||||||||||||||||||||||||||||||||||||||||||||||||||||||||||||||||||||||||||||||||
| Al Gore | ||||||||||||||||||||||||||||||||||||||||||||||||||||||||||||||||||||||||||||||||||||||||||||||||||||
| Apr 20, 2001 | 55 | 41 | 4 | |||||||||||||||||||||||||||||||||||||||||||||||||||||||||||||||||||||||||||||||||||||||||||||||||
| Jan 15, 2001 | 56 | 41 | 3 | |||||||||||||||||||||||||||||||||||||||||||||||||||||||||||||||||||||||||||||||||||||||||||||||||
| Dec 15, 2000 | 57 | 40 | 3 | |||||||||||||||||||||||||||||||||||||||||||||||||||||||||||||||||||||||||||||||||||||||||||||||||
| Bob Dole | ||||||||||||||||||||||||||||||||||||||||||||||||||||||||||||||||||||||||||||||||||||||||||||||||||||
| Apr 18, 1997 | 53 | 39 | 8 | |||||||||||||||||||||||||||||||||||||||||||||||||||||||||||||||||||||||||||||||||||||||||||||||||
| Apr 11, 1997 | 53 | 39 | 8 | |||||||||||||||||||||||||||||||||||||||||||||||||||||||||||||||||||||||||||||||||||||||||||||||||
| Jan 31, 1997 | 57 | 35 | 8 | |||||||||||||||||||||||||||||||||||||||||||||||||||||||||||||||||||||||||||||||||||||||||||||||||
| George H.W. Bush | ||||||||||||||||||||||||||||||||||||||||||||||||||||||||||||||||||||||||||||||||||||||||||||||||||||
| Jan 18, 1993 | 62 | 33 | 5 | |||||||||||||||||||||||||||||||||||||||||||||||||||||||||||||||||||||||||||||||||||||||||||||||||
| Jan 8, 1993 | 68 | 28 | 4 | |||||||||||||||||||||||||||||||||||||||||||||||||||||||||||||||||||||||||||||||||||||||||||||||||
| Nov 10, 1992 | 47 | 50 | 3 | |||||||||||||||||||||||||||||||||||||||||||||||||||||||||||||||||||||||||||||||||||||||||||||||||
| Comparable post-election data not available for John Kerry | ||||||||||||||||||||||||||||||||||||||||||||||||||||||||||||||||||||||||||||||||||||||||||||||||||||
| GALLUP | ||||||||||||||||||||||||||||||||||||||||||||||||||||||||||||||||||||||||||||||||||||||||||||||||||||
Historical data are available in Gallup Analytics.
Survey Methods
Results for this Gallup poll are based on telephone interviews conducted June 7-11, 2017, with a random sample of 1,009 adults, aged 18 and older, living in all 50 U.S. states and the District of Columbia. For results based on the total sample of national adults, the margin of sampling error is ±4 percentage points at the 95% confidence level. All reported margins of sampling error include computed design effects for weighting.
Each sample of national adults includes a minimum quota of 70% cellphone respondents and 30% landline respondents, with additional minimum quotas by time zone within region. Landline and cellular telephone numbers are selected using random-digit-dial methods.
View survey methodology, complete question responses and trends.


