Unbiased news powered by public opinion research and analysis of human behavior around the world


Subscribe to Front Page
Get insights from the voice of the world’s citizens on everything that matters.
World

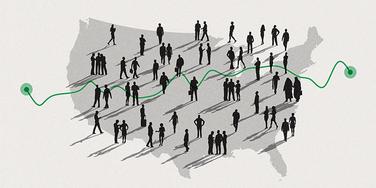
Insights From 20 Years of the Gallup World Poll

Politics
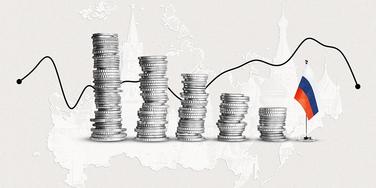
Economics & Personal Finance
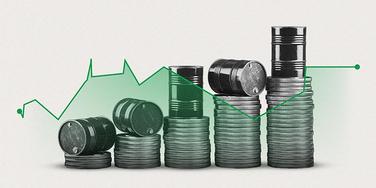
Inside the Trend: Economic Confidence
| Date(s) | U.S. Economic Confidence Index |
|---|---|
| 05/1-17/2026 | -45 |
| 04/1-15/2026 | -38 |
| 03/2-18/2026 | -27 |
| 02/2-17/2026 | -20 |
| 01/2-17/2026 | -20 |
| 12/1-15/2025 | -33 |
| 11/3-25/2025 | -30 |
| 10/1-16/2025 | -23 |
| 09/2-16/2025 | -20 |
| 08/1-20/2025 | -20 |
U.S. Mood & Satisfaction
| Date(s) | U.S. Satisfaction |
|---|---|
| 05/17/2026 | 21% |
| 04/15/2026 | 21% |
| 03/18/2026 | 27% |
| 02/16/2026 | 26% |
| 01/17/2026 | 32% |
| 12/15/2025 | 24% |
| 11/25/2025 | 23% |
| 10/16/2025 | 27% |
| 09/16/2025 | 29% |
| 08/20/2025 | 31% |
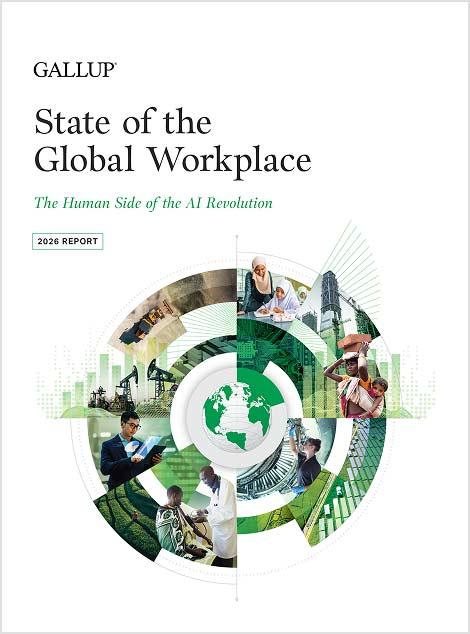
State of the Global Workplace: 2026 Report
Gallup’s new report uncovers a growing challenge for leaders: Employee engagement is declining — and managers are at the center of it. The State of the Global Workplace: 2026 Report, our annual study of employees in more than 140 countries, includes global and country-level data on employee engagement, wellbeing, the shifting job market and more.
Download the report to explore what employees need now, and what leaders can do to meet the moment.


The Gallup Podcast
The Gallup podcast discusses what the world's citizens think about the most pressing issues and how leaders can use the wisdom of the people to make more informed decisions.
Tune in to our latest episodes.

Subscribe to Our Latest Insights
Get analytics and advice about the topics that matter most to you delivered directly to your inbox.