GALLUP NEWS SERVICE
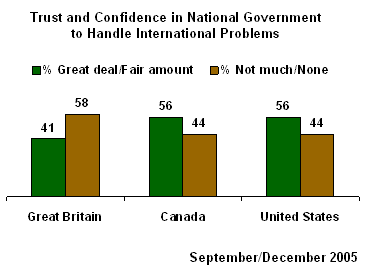
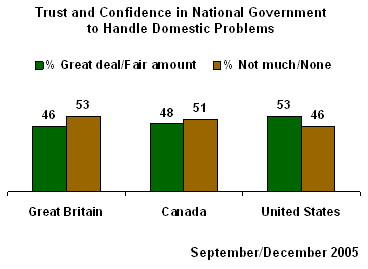
PRINCETON, NJ -- Americans, Canadians, and Britons are all about evenly divided in the amount of trust and confidence they have in their national governments to handle domestic problems. However, Canadians and Americans are a little more positive about their national governments' abilities to deal with international problems, while Britons are somewhat more negative.
These results are based on a series of telephone polls conducted last September in the United States, and last December in Canada and Great Britain. On the question of trust in the national government to handle international problems, Americans and Canadians show identical patterns of support -- 56% express a great deal or fair amount of trust, while 44% say they have not much or no trust. Britons, by contrast, express a net negative evaluation, with 58% expressing little or no trust and 41% a high level of trust.
On whether the national government can be trusted to deal with domestic problems, citizens of all three countries are more divided -- by slight majorities, Britons (53%) and Canadians (51%) say they have little trust, while a slight majority of Americans (53%) express high trust.
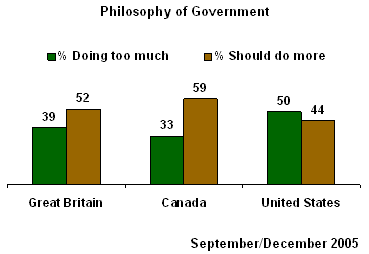
Apart from the amount of trust people have is the question of what role the government should play in society. Majorities of Canadians (59%) and Britons (52%) want the government to do "more to solve our country's problems," while Americans, by a margin of 50% to 44%, say government is already doing too much.
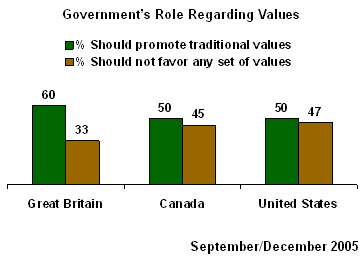
Should the government promote "traditional" values in society, or not favor any particular set of values? By almost a 2-to-1 margin, 60% to 33%, Britons favor government actions on behalf of traditional values; Canadians and Americans are more evenly divided, though they lean toward government promotion of traditional values, by margins of 50% to 45% and 50% to 47%, respectively.
Political Attitudes
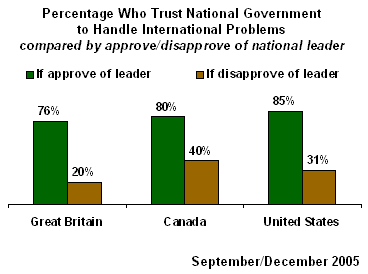
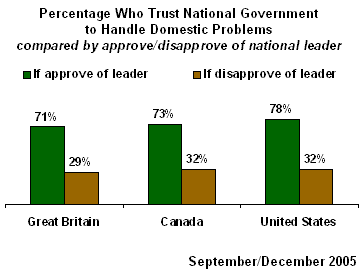
It is expected that trust in government would be related to people's views of their national leader -- the higher the leader's rating, the more trust people should express in their government's ability to handle international and domestic problems. It is not as clear how "political" are the public's views about the proper roles of government in solving problems and promoting values. As it turns out, these last two sets of views are highly political in the United States, but not so political in Canada and Britain.
Among people who approve of the overall job their national leader is doing, trust in the government to handle international problems is quite high in all three countries (from 76% high trust to 85%), while among those who disapprove of their national leader, trust is low (only 20% to 40% express a great deal or fair amount of trust). The differences in levels of trust between those who approve and those who disapprove of their national leaders range from 40 percentage points in Canada (80% high trust among approvers; 40% among disapprovers) to 56 points in Britain (76% vs. 20%).
A similar pattern is found on the issue of trust in government to handle domestic problems. The difference in trust between those who approve and those who disapprove of their national leader is 42 points in Britain, 41 points in Canada, and 46 points in the United States.
Wanting the government to do "more" to solve society's problems is at the liberal end of the spectrum, while saying the government is already doing "too much" is at the conservative end. In the United States, people who disapprove of the conservative President George W. Bush are much more likely to say government should do more (58%) than are people who approve of Bush (29%) -- showing a strong correlation (a 29-point difference) between opinion of Bush and attitudes about the role of government.
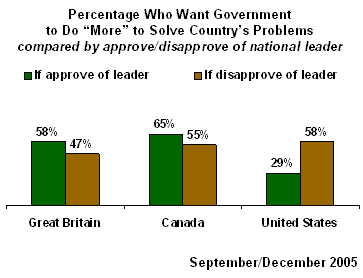
In Britain and Canada, where the political leaders were both from the more liberal parties at the time of the surveys, support for an active governmental role is positively associated with approval of the national leader. However, the differences in support for an active role between those approving and those disapproving of the leader are much smaller than the difference in the United States.
In Britain, 58% of those who approved of Prime Minister Tony Blair chose an active governmental role, compared with 47% who disapproved -- an 11-point difference. In Canada, the difference is about the same, 10 points, between those who approved of Prime Minister Paul Martin and those who disapproved (65% active role vs. 55% active role, respectively).
As for the government's role in promoting values, in neither Canada nor Britain is this role "political" -- it does not correlate with ratings of the national leader. In the United States, however, approval of Bush is strongly correlated with an active role for government in promoting traditional values.
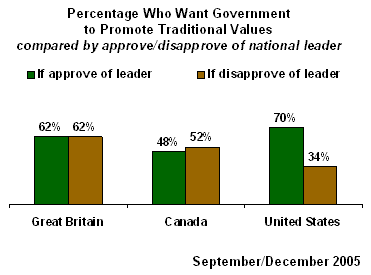
Sixty-two percent of Britons want the government to promote traditional values, whether they approve or disapprove of their national leader. In Canada, there is a small, four-point difference between those who approve and those who disapprove of their national leader. In the United States, the difference is 36 points -- 70% of Americans who approve of Bush want the government to promote traditional values, compared with 34% who disapprove.
Survey Methods
Results in the United States are based on telephone interviews with 921 national adults, aged 18 and older, conducted Sept. 12-15, 2005. For results based on the total sample of national adults, one can say with 95% confidence that the maximum margin of sampling error is ±3 percentage points. Gallup USA conducted the survey.
Results in Canada are based on telephone interviews with 1,003 national adults, aged 18 and older, conducted Dec. 12-18, 2005. For results based on the total sample of national adults, one can say with 95% confidence that the maximum margin of sampling error is ±3 percentage points. Gallup Canada conducted the survey.
Results in Great Britain are based on telephone interviews with 1,010 national adults, aged 18 and older, conducted Dec. 12-20, 2005. For results based on the total sample of national adults, one can say with 95% confidence that the maximum margin of sampling error is ±5 percentage points. Gallup UK conducted the survey.
In addition to sampling error, question wording and practical difficulties in conducting surveys can introduce error or bias into the findings of public opinion polls.
8. How much trust and confidence do you have in our federal government (United States: in Washington/Great Britain: national government) when it comes to handling [Read A-B] -- a great deal, a fair amount, not very much, or none at all?
A. International Problems
|
|
Great |
Fair |
Not very |
None |
No |
|
United States |
% |
% |
% |
% |
% |
|
2005 Sep 12-15 |
14 |
42 |
33 |
11 |
* |
|
2004 Sep 13-15 |
18 |
45 |
28 |
8 |
1 |
|
2003 Sep 8-10 |
16 |
47 |
27 |
9 |
1 |
|
|
|
|
|
|
|
|
Canada |
|
|
|
|
|
|
2005 Dec 12-18 |
9 |
47 |
33 |
11 |
* |
|
2004 Dec 6-12 |
9 |
47 |
34 |
9 |
1 |
|
2003 Dec 5-11 |
8 |
52 |
32 |
7 |
1 |
|
|
|
|
|
|
|
|
Great Britain |
|
|
|
|
|
|
2005 Dec 12-20 |
5 |
36 |
43 |
15 |
1 |
|
2004 Dec 1-21 |
6 |
36 |
43 |
15 |
1 |
|
2003 Dec 2-21 |
6 |
43 |
37 |
12 |
1 |
|
* Less than 0.5% |
|||||
B. Domestic Problems
|
|
Great |
Fair |
Not very |
None |
No |
|
United States |
% |
% |
% |
% |
% |
|
2005 Sep 12-15 |
10 |
43 |
35 |
11 |
1 |
|
2004 Sep 13-15 |
13 |
48 |
31 |
7 |
1 |
|
2003 Sep 8-10 |
9 |
49 |
32 |
9 |
1 |
|
|
|
|
|
|
|
|
Canada |
|
|
|
|
|
|
2005 Dec 12-18 |
4 |
44 |
37 |
14 |
1 |
|
2004 Dec 6-12 |
7 |
46 |
37 |
9 |
1 |
|
2003 Dec 5-11 |
6 |
52 |
33 |
8 |
1 |
|
|
|
|
|
|
|
|
Great Britain |
|
|
|
|
|
|
2005 Dec 12-20 |
5 |
41 |
41 |
12 |
1 |
|
2004 Dec 1-21 |
5 |
40 |
41 |
12 |
2 |
|
2003 Dec 2-21 |
4 |
42 |
40 |
12 |
2 |
9. Some people think the government is trying to do too many things that should be left to individuals and businesses. Others think that government should do more to solve our country's problems. Which comes closer to your own view?
|
|
Government |
Government |
No |
|
United States |
% |
% |
% |
|
2005 Sep 12-15 |
50 |
44 |
6 |
|
2003 Sep 8-10 |
51 |
43 |
6 |
|
|
|
|
|
|
Canada |
|
|
|
|
2005 Dec 12-18 |
33 |
59 |
8 |
|
2003 Dec 5-11 |
34 |
59 |
7 |
|
|
|
|
|
|
Great Britain |
|
|
|
|
2005 Dec 12-20 |
39 |
52 |
9 |
|
2003 Dec 2-21 |
29 |
62 |
10 |
10. Some people think the government should promote traditional values in our society. Others think the government should not favor any particular set of values. Which comes closer to your own view?
|
|
Promote |
Not favor |
No |
|
United States |
% |
% |
% |
|
2005 Sep 12-15 |
50 |
47 |
3 |
|
2003 Sep 8-10 |
56 |
40 |
4 |
|
|
|
|
|
|
Canada |
|
|
|
|
2005 Dec 12-18 |
50 |
45 |
5 |
|
2003 Dec 5-11 |
51 |
43 |
6 |
|
|
|
|
|
|
Great Britain |
|
|
|
|
2005 Dec 12-20 |
60 |
33 |
7 |
|
2003 Dec 2-21 |
63 |
28 |
9 |