GALLUP NEWS SERVICE
PRINCETON, NJ -- A new Major League Baseball season is underway, and Gallup finds that just under half of Americans consider themselves to be baseball fans. Traditionally known as "America's Pastime," baseball trails football as the top sport in the United States, both in terms of the percentage of Americans who say they are fans of the sport, and the percentage who say it is their favorite sport to watch. While baseball's fan base is fairly consistent across demographic categories, older Americans are much more likely than younger Americans to name baseball as their favorite sport.
Americans as Baseball Fans
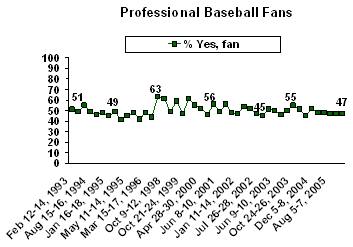
A Mar. 10-12, 2006 CNN/USA Today/Gallup poll finds 47% of Americans identifying themselves as fans of professional baseball. Since the beginning of 2005, Gallup has asked Americans on five separate occasions whether they consider themselves fans of professional baseball, and the percentage has been 47% or 48% in each survey.
The trend line shows that the percentage of Americans identifying as baseball fans has not always been so consistent. It has varied significantly in response to events happening in the sport. The recent high point was in Sept. 1998, just after Mark McGwire and Sammy Sosa surpassed Roger Maris' record 61 home runs in one season, when 63% of Americans said they were baseball fans. The low point was 41% in April 1995, just before Major League Baseball resumed play following its last (and longest) player strike.

In addition to baseball, Gallup has asked the fan identification question periodically for many other sports since 1993. Baseball trails only professional football in the percentage of Americans who identify as fans. College football and figure skating have the next greatest share of fans among the United States public.
|
Average Percent Identifying as Fans 1993-2006 Gallup Poll Data |
||
|
Average |
Times |
|
|
% |
|
|
|
Professional football |
59 |
10 |
|
Professional baseball |
50 |
45 |
|
College football |
47 |
7 |
|
Figure skating |
46 |
2 |
|
Professional basketball |
42 |
12 |
|
College basketball |
42 |
4 |
|
Auto racing |
35 |
2 |
|
Professional golf |
33 |
6 |
|
Professional ice hockey |
29 |
3 |
|
Professional tennis |
26 |
2 |
|
Professional wrestling |
14 |
3 |
The 47% average for baseball measured over the past fifteen months is slightly lower than the historical average of 50% in polls stretching back to 1993. During the four year period from 1998 to 2001, when baseball's home run record was broken first by McGwire then by Barry Bonds, an average of 53% of Americans identified as fans.
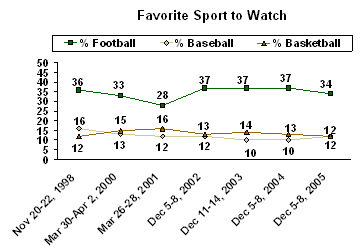
In addition to tracking the percentage of Americans who say they are fans of various sports, for many years Gallup has asked Americans to name their favorite sport. On this measure, baseball trails football by a considerable margin. The last time the question was asked -- in December 2005 -- 34% of Americans named football as their favorite sport, while 12% each said baseball and basketball. The next most favored sports were auto racing (5%) and ice hockey (4%).
Despite a higher percentage of fans than professional or college basketball (which both average 42%), baseball has either trailed, or, at best, been tied with basketball as the favorite sport measured since 2000.

Historically, baseball topped the list of favorite sports when Gallup asked the question between 1937 and 1960. In 1972, football overtook baseball and has widened the gap ever since.
Demographics of Baseball Fans
An analysis of the last five polls in which the baseball fan question has been asked indicates that baseball's fan base is fairly broad demographically and not necessarily distinct from the fan bases of other sports.
As with most other sports (figure skating being the notable exception), men (54%) are significantly more likely than women (41%) to say they are baseball fans. Americans who come from higher income households are also more likely to identify as baseball fans than those from lower income households, but that pattern is also evident for other sports, particularly college football and college basketball.
|
Baseball Fans by Household Income Level 2005-2006 Gallup Poll Data |
|
|
Baseball |
|
|
% |
|
|
Less than $30,000 |
41 |
|
$30,000 to less than $74,999 |
48 |
|
$75,000 or more |
54 |
On other key demographics, however, there are no meaningful differences in baseball fans and non-fans.
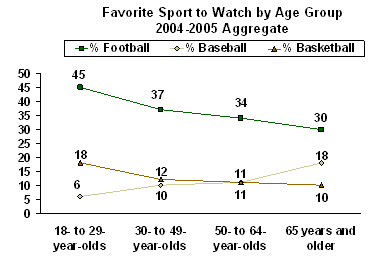
However, there are significant age differences on the favorite sport question. In the combined data from the 2004-2005 measurements, just 6% of 18-to 29-year-olds say baseball is their favorite sport. That compares with 10% among 30-to 49-year-olds, 11% among 50-to 64-year olds, and 18% among those aged 65 and older. Basketball shows a reverse pattern, with a higher proportion of younger Americans and a lower percentage of older Americans saying it is their favorite sport.

Even so, 47% of 18-to 29-year-olds still consider themselves baseball fans; a percentage that is essentially the same as that found in every other age group: 46% of 30-to 39-year-olds, 48% of 50-to 64-year-olds, and 47% of those aged 65 and older.
Survey Methods
These results are based on telephone interviews with randomly selected national samples of approximately 1,000 adults, aged 18 and older. For results based on these samples, one can say with 95% confidence that the maximum error attributable to sampling and other random effects is ±3 percentage points. In addition to sampling error, question wording and practical difficulties in conducting surveys can introduce error or bias into the findings of public opinion polls.
Are you a fan of professional baseball, or not?
|
Yes, |
Somewhat |
No, |
No |
|
|
% |
% |
% |
% |
|
|
2006 Mar 10-12 |
37 |
10 |
53 |
-- |
|
2005 Dec 9-11 |
36 |
11 |
53 |
* |
|
2005 Aug 5-7 |
37 |
10 |
53 |
* |
|
2005 Mar 18-20 |
39 |
9 |
52 |
* |
|
2005 Jan 14-16 |
41 |
7 |
52 |
* |
|
2004 Dec 5-8 |
43 |
9 |
48 |
* |
|
2004 Mar 26-28 |
36 |
9 |
55 |
* |
|
2003 Nov 14-16 |
43 |
8 |
49 |
* |
|
2003 Oct 24-26 |
44 |
11 |
45 |
-- |
|
2003 Oct 10-12 |
42 |
8 |
50 |
* |
|
2003 Jun 27-29 |
36 |
10 |
54 |
* |
|
2003 Jun 9-10 |
39 |
11 |
50 |
* |
|
2002 Nov 8-10 |
38 |
13 |
49 |
* |
|
2002 Aug 19-21 |
37 |
8 |
54 |
1 |
|
2002 Jul 26-28 |
37 |
10 |
53 |
* |
|
2002 Jun 7-8 |
36 |
16 |
48 |
-- |
|
2002 Mar 22-24 |
44 |
10 |
46 |
* |
|
2002 Jan 11-14 |
36 |
11 |
53 |
* |
|
2001 Nov 26-27 |
38 |
10 |
52 |
* |
|
2001 Nov 2-4 |
45 |
11 |
44 |
* |
|
2001 Jun 8-10 |
35 |
14 |
51 |
-- |
|
2001 Mar 26-28 |
46 |
10 |
44 |
* |
|
2000 May 5-7 |
35 |
11 |
54 |
-- |
|
2000 Apr 28-30 |
40 |
12 |
48 |
-- |
|
2000 Mar 30-Apr 2 |
45 |
10 |
45 |
-- |
|
1999 Nov 18-21 |
45 |
16 |
39 |
-- |
|
1999 Oct 21-24 |
37 |
10 |
53 |
-- |
|
1999 Jul 13-14 |
40 |
19 |
41 |
-- |
|
1999 Mar 19-21 |
34 |
15 |
51 |
-- |
|
1998 Oct 9-12 |
47 |
14 |
39 |
-- |
|
1998 Sep 14-15 |
45 |
18 |
37 |
-- |
|
1998 Jun 22-23 |
34 |
10 |
56 |
-- |
|
1996 Mar 15-17 |
38 |
10 |
52 |
-- |
|
1995 Oct 5-7 |
34 |
8 |
58 |
-- |
|
1995 Jul 7-9 |
35 |
13 |
52 |
-- |
|
1995 May 11-14 |
35 |
10 |
55 |
-- |
|
1995 Apr 17-19 |
32 |
9 |
59 |
-- |
|
1995 Feb 24-26 |
37 |
12 |
51 |
-- |
|
1995 Jan 16-18 |
37 |
8 |
55 |
-- |
|
1994 Oct 17-19 |
39 |
9 |
52 |
-- |
|
1994 Sep 6-7 |
35 |
11 |
54 |
-- |
|
1994 Aug 15-16 |
39 |
10 |
51 |
-- |
|
1994 Aug 8-9 |
35 |
20 |
45 |
-- |
|
1993 May 21-23 |
39 |
10 |
51 |
-- |
|
1993 Feb 12-14 |
44 |
7 |
49 |
-- |
|
* Less than 0.5% |
||||
|
(vol.) Volunteered response |
||||
What is your favorite sport to watch?
|
2005 |
2004 |
2003 |
2002 |
2001 |
|
|
% |
% |
% |
% |
% |
|
|
Football |
34 |
37 |
37 |
37 |
28 |
|
Baseball |
12 |
10 |
10 |
12 |
12 |
|
Basketball |
12 |
13 |
14 |
13 |
16 |
|
Auto Racing |
5 |
5 |
5 |
5 |
6 |
|
Ice hockey |
4 |
3 |
5 |
3 |
3 |
|
Ice/Figure Skating |
3 |
4 |
6 |
4 |
4 |
|
Tennis |
3 |
2 |
1 |
2 |
2 |
|
Soccer |
3 |
2 |
2 |
2 |
2 |
|
Golf |
2 |
2 |
3 |
2 |
4 |
|
Boxing |
1 |
1 |
2 |
1 |
2 |
|
Wrestling |
1 |
1 |
1 |
1 |
1 |
|
Volleyball |
1 |
-- |
* |
-- |
1 |
|
Rodeo |
1 |
1 |
* |
1 |
1 |
|
Fishing |
1 |
* |
* |
1 |
* |
|
Gymnastics |
* |
1 |
1 |
1 |
1 |
|
Motocross |
* |
1 |
* |
-- |
1 |
|
Bowling |
* |
* |
* |
1 |
* |
|
Swimming |
* |
* |
* |
1 |
* |
|
|
|
|
|
|
|
|
OTHER |
4 |
4 |
4 |
2 |
4 |
|
NONE |
13 |
12 |
9 |
10 |
12 |
|
No Opinion |
* |
1 |
* |
1 |
1 |
|
* Less than 0.5% |
|||||
Long Term Trend
|
|
|
Basket- |
Auto |
Ice/ |
Ice |
|
|
% |
% |
% |
% |
% |
% |
|
|
2005 Dec 5-8 |
34 |
12 |
12 |
5 |
3 |
4 |
|
2004 Dec 5-8 |
37 |
10 |
13 |
5 |
4 |
3 |
|
2003 Dec 11-14 |
37 |
10 |
14 |
5 |
6 |
5 |
|
2002 Dec 5-8 |
37 |
12 |
13 |
5 |
4 |
3 |
|
2001 Mar 26-28 |
28 |
12 |
16 |
6 |
4 |
3 |
|
2000 Mar 30-Apr 2 |
33 |
13 |
15 |
5 |
4 |
5 |
|
1998 Nov 20-22 |
36 |
16 |
12 |
3 |
2 |
3 |
|
1997 Apr 18-20 ^ |
30 |
14 |
17 |
7 |
2 |
3 |
|
1995 Apr 17-19 |
32 |
16 |
15 |
2 |
2 |
3 |
|
1994 Sep 16-20 |
37 |
16 |
13 |
2 |
3 |
1 |
|
1994 Aug 8-9 |
35 |
21 |
11 |
2 |
3 |
3 |
|
1992 Sept |
38 |
16 |
12 |
2 |
2 |
4 |
|
1990 Feb |
35 |
16 |
15 |
1 |
2 |
3 |
|
1981 Jan |
38 |
16 |
9 |
1 |
2 |
2 |
|
1972 Oct |
32 |
24 |
9 |
2 |
1 |
4 |
|
1960 Dec |
21 |
34 |
9 |
* |
1 |
3 |
|
1948 Apr 9-14 |
17 |
39 |
10 |
1 |
* |
3 |
|
1937 Mar 24-29 |
23 |
34 |
8 |
1 |
1 |
2 |
|
^ WORDING: What is your favorite sport to follow? |
||||||
|
* Less than 0.5% |
||||||