GALLUP NEWS SERVICE
PRINCETON, NJ -- According to a Gallup poll conducted October 6-9, 2000, the vast majority of Americans are happy on a personal level and optimistic about the future of the United States. Marital status has a powerful impact on the levels of both happiness and optimism. Personal happiness is also significantly influenced by religious habits, and political ideology is a key indicator of optimism about the future of the nation.
Married Women and Those With Firm Religious Habits Are
Happiest
More than nine in ten Americans -- 94% -- describe themselves as
"very" or "fairly" happy. Nearly one-half of all Americans -- 47%
-- classify themselves as "very happy." Since Gallup began asking
this question in 1956, an average of 47% of Americans have
considered themselves "very happy," with a high of 53% in both 1956
and 1957.
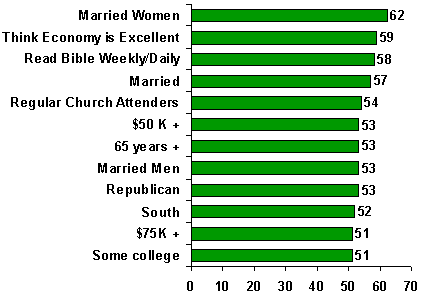
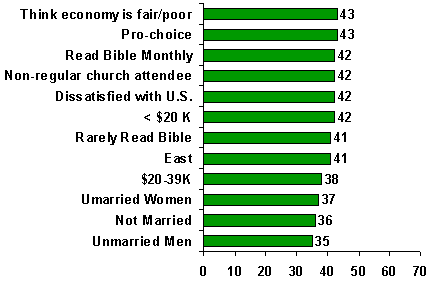
Marital status and religious habits both have a strong influence on happiness.Individuals who are married -- particularly women -- are substantially happier than those who are not married.
|
% Who Are "Very Happy" |
||
|
Married |
Unmarried |
|
|
Total |
57% |
36% |
|
Men |
53 |
35 |
|
Women |
62 |
37 |
Those who attend church weekly or almost weekly are happier than those who attend less often and those who read the Bible daily or weekly are happier than those who read it less often.
|
% "Very Happy" |
|
|
Attend Church |
|
|
Weekly/Almost weekly |
54% |
|
Less often |
42 |
|
Read Bible |
|
|
Daily/Weekly |
58% |
|
Monthly/Less than monthly |
42 |
|
Rarely/Never |
41 |
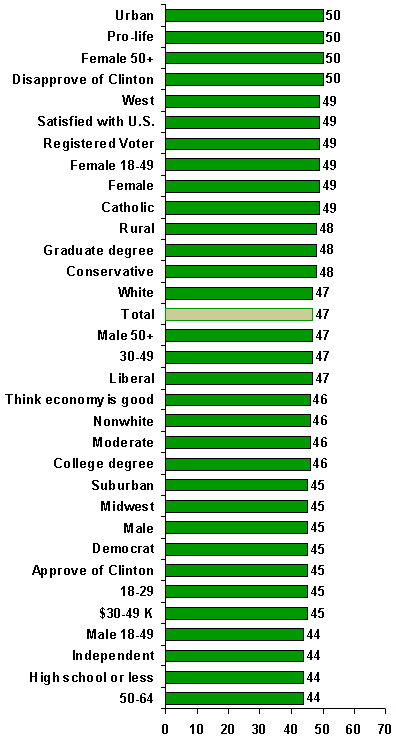
Gender, age and race do not substantially impact happiness. Females are slightly happier than males, with 49% of females saying they are "very happy," compared to 45% of males. The levels of happiness indicated by white Americans and nonwhite Americans are virtually identical -- 47% of white Americans are "very happy," compared to 46% of nonwhite Americans. While more Americans aged 65 and older than in any other age group describe themselves as "very happy" -- 53% -- this age group also has the largest proportion describing themselves as "not too happy" -- 8%.
Republicans are happier than Democrats and independents. Slightly more than one-half of Republicans describe themselves as "very happy" -- 53% -- compared to 45% of Democrats and 44% of independents.
Increased optimism about the economic conditions in the United States today is related to higher levels of personal happiness, and Americans who are satisfied with the current state of affairs in the country are personally happier than those who are dissatisfied with the U.S.
Americans living in the southern and western United States are slightly happier than those living in other regions. City dwellers are slightly happier than their rural and suburban counterparts. One-half of those living in urban communities are happy, compared to 48% of those living in rural communities and 45% in suburban communities.
Above Average Happiness
Generally speaking, how happy would you say you are --. very
happy, fairly happy, or not too happy?
% Saying "Very Happy"

October 6-9, 2000
Sample Size=1,052
Average Happiness
Generally speaking, how happy would you say you are --. very
happy, fairly happy, or not too happy?
% Saying "Very Happy"

October 6-9, 2000
Sample Size=1,052
Below Average Happiness
Generally speaking, how happy would you say you are --. very
happy, fairly happy, or not too happy?
% Saying "Very Happy"

October 6-9, 2000
Sample Size=1,052
Married Women and Those With Moderate Ideologies Are Most
Optimistic About the Country's Future
Nearly four in five Americans -- 78% -- have optimistic outlooks
regarding the future of the United States. As with happiness,
marital status significantly impacts optimism, particularly for
women. More than four in five married people -- 82% -- express
optimism about the future of the country, compared to 73% of those
who are unmarried. Eighty-five percent of married women are
optimistic, versus 72% of unmarried women.
|
Optimism About Future of U.S. by Marital Status |
||
|
Married |
Unmarried |
|
|
Total |
82% |
73% |
|
Men |
78 |
74 |
|
Women |
85 |
72 |
Those who classify their political ideology as moderate are more optimistic about the future than are conservatives or liberals and, while Republicans are happier than members of the other political parties on a personal level, Democrats are somewhat more optimistic about the future of the country than are Republicans or independents. Eighty-five percent of moderates are optimistic, compared to 73% of conservatives and 71% of liberals. Eighty-three percent of Democrats are optimistic, compared to 75% of Republicans and 73% of independents.
Those expressing satisfaction with the United States in general have greater levels of optimism than do those who are dissatisfied (89% versus 58%). And, similarly, those who classify the economic conditions in the country as "excellent" or "good" are more optimistic about the future of the U.S. than are those who consider the economic conditions to be fair or poor.
White Americans are slightly less optimistic about the future of the U.S. than are nonwhites. Seventy-seven percent of white Americans express optimism compared to 83% of nonwhite Americans.
Optimism increases with income and education. Nearly nine in ten Americans earning $75,000 or more annually -- 87% -- are optimistic about the future of the United States, compared to 68% of those earning less than $20,000 annually. Nearly nine in ten college graduates -- 88% -- are optimistic, versus 70% of those with a high school education or less. Eighty-four percent of those with postgraduate degrees are optimistic.
The impact of religious habits on optimism levels about the future is the reverse of their impact on happiness. Those who rarely read the Bible are more optimistic than are those who read it daily or weekly and those who attend church infrequently are more optimistic than are those who attend weekly or almost weekly.
|
% opti- |
|
|
Attend church |
|
|
Weekly/Almost weekly |
72% |
|
Less often |
81 |
|
Read Bible |
|
|
Daily/Weekly |
72% |
|
Monthly/Less than monthly |
78 |
|
Rarely/Never |
82 |
Optimism decreases slightly with age. While four in five 18- to 29-year-olds are optimistic about the future of the U.S. and nearly as many 30- to 49-year-olds and 50- to 64-year-olds express optimism -- 79% each -- a smaller proportion of those 65 and older -- 71% -- are optimistic.
Males and females have similar levels of optimism, with 77% of males expressing optimism about the future of the U.S., compared to 79% of females.
While optimism decreases slightly with age and men and women tend to express comparable levels of optimism, these patterns change when the two variables are considered simultaneously. Men grow slightly more optimistic with age, while women grow slightly less optimistic.
Americans living in the Eastern region of the U.S. have slightly greater optimism regarding the future of the U.S. than do those living in other regions. Inhabitants of the Midwest have the lowest level of optimism. Americans living in urban and suburban communities are generally more optimistic than are those living in rural communities.
Survey Methods
The results below are based on telephone interviews with a randomly selected national sample of 1,052 adults, 18 years and older, conducted October 6-9, 2000. For results based on this sample, one can say with 95 percent confidence that the maximum error attributable to sampling and other random effects is plus or minus 3 percentage points. In addition to sampling error, question wording and practical difficulties in conducting surveys can introduce error or bias into the findings of public opinion polls.
What is your outlook for the United States during the next 20 years? Would you say it is -- very optimistic, optimistic, pessimistic, or very pessimistic?
|
Very opti- |
|
|
Very pessi- |
No |
|
|
% |
% |
% |
% |
% |
|
|
2000 Oct 6-9 |
8 |
70 |
16 |
4 |
2 |
|
1991 May 23-26 |
10 |
69 |
15 |
4 |
2 |
|
1979 Aug 3-6 |
7 |
44 |
29 |
10 |
10 |
|
1978 Nov 10-13 ^ |
8 |
55 |
23 |
6 |
8 |
|
^ Conducted by Christianity Today/Gallup |
|||||
Generally speaking, how happy would you say you are -- very happy, fairly happy, or not too happy?
|
Very happy |
Fairly happy |
Not too happy |
No opinion |
|
|
% |
% |
% |
% |
|
|
2000 Oct 6-9 |
47 |
47 |
5 |
1 |
|
1996 Mar 8-10 |
49 |
46 |
5 |
* |
|
1992 Feb 28-Mar 1 |
43 |
47 |
9 |
1 |
|
1991 Feb 21 |
44 |
45 |
10 |
1 |
|
1982 Dec 10 |
50 |
43 |
6 |
* |
|
1981 Dec 11 |
44 |
51 |
5 |
* |
|
1981 Jun 5 |
46 |
43 |
10 |
1 |
|
1977 Nov 4 |
42 |
48 |
10 |
1 |
|
1957 Mar 5 ^ |
53 |
43 |
3 |
* |
|
1956 Sep 20 ^ |
53 |
42 |
5 |
* |
|
^ Third response category different wording: "or not very
happy" |
||||