GALLUP NEWS SERVICE
PRINCETON, NJ -- The U.S. Supreme Court waded into familiar territory on Thursday, issuing a decision about racial quotas in public education that has its critics revisiting the school busing debates of the past.
In striking down racial quotas in public school choice plans in two states, the court ruled that admittance policies to public schools spanning the K-12 years must be colorblind, even if the goal is to increase classroom diversity. As Chief Justice Roberts wrote in the majority opinion, "The way to stop discrimination on the basis of race is to stop discriminating on the basis of race." Opponents of the decision consider it an alarming reversal of the court's historical interest in achieving racial integration in the public schools.
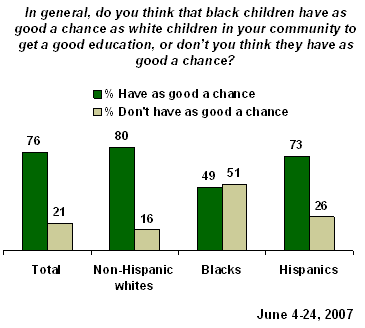
Although Gallup has not asked Americans specifically about this case, new Gallup data on public attitudes toward black educational opportunity, generally, can provide some clues about how the decision is being perceived. In its annual Minority Rights and Relations survey, updated June 4-24, 2007, Gallup asked Americans, including large samples of blacks and Hispanics, "In general, do you think that black children have as good a chance as white children in your community to get a good education, or don't you think they have as good a chance?"
Overall, three-quarters of Americans believe black children do have the same chance as white children in their communities to get a good education. However, blacks see the issue very differently from whites and Hispanics. Whereas 80% of non-Hispanic whites and 73% of Hispanics believe black children and white children have equal educational opportunities, just about half of blacks (49%) agree.
Blacks' views on this question are highly uniform, with no major differences seen according to their sex, age, income, or personal educational background.
|
Perceptions of Educational Opportunity for Black Children in Their Communities
|
||
|
|
Have as good
|
Do not have
|
|
% |
% |
|
|
Male |
50 |
49 |
|
Female |
48 |
52 |
|
|
|
|
|
18-49 |
50 |
49 |
|
50+ |
46 |
53 |
|
|
|
|
|
High school grad or less |
49 |
51 |
|
College educated |
48 |
51 |
|
|
|
|
|
Earn less than $30,000 |
47 |
52 |
|
Earn $30,000-$74,999 |
52 |
48 |
|
Earn $75,000 |
46 |
54 |
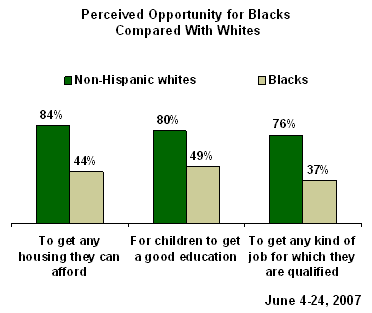
It should be noted that blacks are similarly pessimistic relative to whites about black opportunities in the housing and job markets. Whereas three-quarters or more of whites believe blacks and whites have equal opportunities in each of these areas, far fewer blacks share that view.
Views of Black vs. White Democrats
The court's decision in Parents Involved in Community Schools v. Seattle School District No. 1 was issued on Thursday June 28, just hours before eight Democratic candidates for president met in a debate held at Howard University, where the focus was already expected to be on issues of importance to the black community. Several of the candidates, including Hillary Clinton and Barack Obama -- who are in a close battle for the black vote in their party -- used the opportunity to blast the decision.
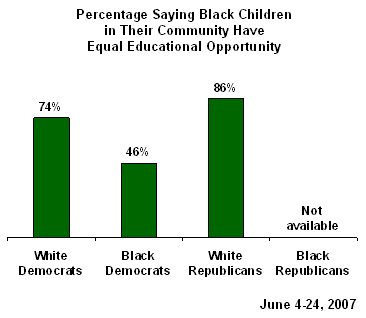
Those comments are likely to be well received by blacks within their own party. Most blacks are Democratic, and among black Democrats, specifically, 46% say black children and white children in their communities have equal chances at a good education, while 53% think they do not. (There are not enough black Republicans in the survey to break out their views separately.)
However, given the widespread belief among white Democrats that the black children and white children where they live have equal educational opportunities, the issue could play out differently among this group.
"Merit" Trumps Diversity
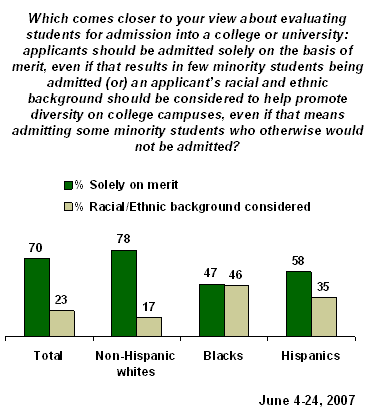
The issue of racial quotas in education is addressed in Gallup's latest survey, but only with respect to college admittance. When asked whether applicants to college should be admitted solely on the basis of merit, or whether race and ethnic background should be considered in order to promote diversity on college campuses, the vast majority of non-Hispanic whites (78%) favor a merit-only approach, whereas blacks are evenly divided, with 47% favoring merit. Hispanics divide 58% vs. 35% in favor of merit.
Again, even among Democrats, there is a large racial divide on the issue. Nearly 7 in 10 white Democrats (69%), compared with fewer than half of black Democrats (42%), say college admittance should be based solely on merit.
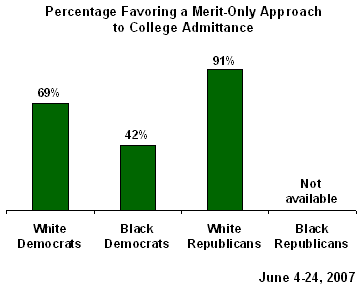
Other questions probing public attitudes about quotas and affirmative action have shown broader public support for policy initiatives aimed at boosting educational opportunities for racial and ethnic minorities. But the results to this specific question seem to indicate that "merit"-based admittance has a strong appeal to Americans, possibly tapping into deeper beliefs about the "American Way."
Bottom Line
The latest Supreme Court decision touching on race in public schools is being described as a "dramatic" and potentially "landmark" decision that will have major ramifications for school districts across the country. Public reaction to it will partly depend on how it is ultimately explained and characterized in the media, in the black community, and by Republican and Democratic leaders. However, the decision appears congruent with some fundamental public attitudes about race and education today. Most Americans, and even close to half of black Americans, believe black children in their communities have as good a chance as white children to get a good education. And when the issue of quotas is framed as a choice between merit-only admissions vs. diversity promotion, Americans are strongly attracted to the former.
Survey Methods
Results are based on telephone interviews with 2,388 adults nationwide, aged 18 and older, conducted June 4-24, 2007, including oversamples of blacks and Hispanics that are weighted to reflect their proportions in the general population. For results based on the total sample of national adults, one can say with 95% confidence that the maximum margin of sampling error is ±5 percentage points.
For results based on sample of 868 non-Hispanic whites, the maximum margin of sampling error is ±7 percentage points.
For results based on sample of 802 blacks, the maximum margin of sampling error is ±6 percentage points.
For results based on sample of 502 Hispanics, the maximum margin of sampling error is ±6 percentage points (138 out of the 502 interviews with Hispanics were conducted in Spanish).
In addition to sampling error, question wording and practical difficulties in conducting surveys can introduce error or bias into the findings of public opinion polls.
9. In general, do you think that black children have as good a chance as white children in your community to get a good education, or don't you think they have as good a chance?
|
|
Have as
|
Don't have
|
No
|
|
Total |
% |
% |
% |
|
2007 Jun 4-24 |
76 |
21 |
3 |
|
2005 Jun 6-25 |
79 |
19 |
2 |
|
2004 Jun 9-30 |
80 |
19 |
1 |
|
2002 Dec 9-2003 Feb 11 |
77 |
20 |
3 |
|
2001 Mar 23-May 16 |
80 |
18 |
2 |
|
1999 Sep 24-Nov 16 |
82 |
15 |
3 |
|
1997 May 30-Jun 1 |
76 |
21 |
3 |
|
1995 Oct 19-22 |
82 |
14 |
4 |
|
1991 Jun 13-16 |
81 |
15 |
4 |
|
1990 Jun 7-10 |
83 |
11 |
6 |
|
1989 Dec 7-10 |
80 |
15 |
5 |
|
1962 Aug 23-28 ^ |
83 |
7 |
10 |
|
|
|
|
|
|
Non-Hispanic Whites |
|
|
|
|
2007 Jun 4-24 |
80 |
16 |
3 |
|
2005 Jun 6-25 |
85 |
13 |
2 |
|
2004 Jun 9-30 |
86 |
14 |
* |
|
|
|
|
|
|
Long-term trend |
|||
|
Whites (including Hispanics) |
|||
|
2007 Jun 4-24 |
80 |
17 |
3 |
|
2005 Jun 6-25 |
84 |
14 |
2 |
|
2004 Jun 9-30 |
85 |
15 |
* |
|
2002 Dec 9-2003 Feb 11 |
81 |
17 |
2 |
|
2001 Mar 23-May 16 |
85 |
13 |
2 |
|
1999 Sep 24-Nov 16 |
86 |
12 |
2 |
|
1997 May 30-Jun 1 |
79 |
18 |
3 |
|
1995 Oct 19-22 |
85 |
11 |
4 |
|
1991 Jun 13-16 |
83 |
13 |
4 |
|
1990 Jun 7-10 |
85 |
9 |
6 |
|
1989 Dec 7-10 |
82 |
13 |
5 |
|
1962 Aug 23-28 ^ |
85 |
4 |
10 |
|
|
|
|
|
|
Blacks |
|
|
|
|
2007 Jun 4-24 |
49 |
51 |
* |
|
2005 Jun 6-25 |
51 |
47 |
2 |
|
2004 Jun 9-30 |
51 |
48 |
1 |
|
2002 Dec 9-2003 Feb 11 |
50 |
49 |
1 |
|
2001 Mar 23-May 16 |
52 |
46 |
2 |
|
1999 Sep 24-Nov 16 |
56 |
39 |
5 |
|
1997 May 30-Jun 1 |
63 |
35 |
2 |
|
1995 Oct 19-22 |
64 |
33 |
3 |
|
1991 Jun 13-16 |
56 |
38 |
6 |
|
1990 Jun 7-10 |
68 |
29 |
3 |
|
1989 Dec 7-10 |
61 |
33 |
6 |
|
1962 Aug 23-28^ |
53 |
41 |
6 |
|
|
|
|
|
|
Hispanics |
|
|
|
|
2007 Jun 4-24 |
73 |
26 |
* |
|
2005 Jun 6-25 |
74 |
24 |
2 |
|
2004 Jun 9-30 |
77 |
21 |
2 |
|
|
|
|
|
|
* Less than 0.5% |
|||
|
^ WORDING: Negro children |
|||
23. Which comes closer to your view about evaluating students for admission into a college or university -- [ROTATED: applicants should be admitted solely on the basis of merit, even if that results in few minority students being admitted (or) an applicant's racial and ethnic background should be considered to help promote diversity on college campuses, even if that means admitting some minority students who otherwise would not be admitted]?
|
|
|
Racial/ethnic
|
No
|
|
Total |
% |
% |
% |
|
2007 Jun 4-24 |
70 |
23 |
6 |
|
2003 Jun 12-18 |
69 |
27 |
4 |
|
|
|
|
|
|
Non-Hispanic Whites |
|
|
|
|
2007 Jun 4-24 |
78 |
17 |
5 |
|
2003 Jun 12-15 |
75 |
22 |
3 |
|
|
|
|
|
|
Blacks |
|
|
|
|
2007 Jun 4-24 |
47 |
46 |
8 |
|
2003 Jun 12-18 |
44 |
49 |
7 |
|
|
|
|
|
|
Hispanics |
|
|
|
|
2007 Jun 4-24 |
58 |
35 |
7 |
|
2003 Jun 12-18 |
59 |
36 |
5 |
