PRINCETON, NJ -- Americans' ratings of the current economy have slipped back to the low points measured in January and February of this year, which in turn were lower than at any point since 1996. Perceptions that the economy is getting better have dropped substantially, to the point where they were last fall after Sept. 11. Both of these measures underwent a mini-rally effect of sorts earlier this year, but it is clear that the public has now lost its conviction that an economic rally is coming anytime soon. Still, it is important to note that the current ratings of the economy are not as negative as they were a decade ago. And optimism that the economy will get better is still higher than it was at many points last year, before Sept. 11, and also higher than in the early years of this decade. About half of Americans are satisfied with the way things are going in the country today, above average, but down significantly from earlier this year.
Ratings of the Current Economy
We have measured Americans' perceptions of the U.S. economy since 1992 using this question: "How would you rate economic conditions in this country today -- as excellent, good, only fair, or poor?"
The range in the yearly average of the economy as "excellent" or "good" has extended from a low point of 13% in 1992, to the high point of 69% in 2000. The overall average across the past 11 years is 41%.
| Rating of Current Economic Conditions |
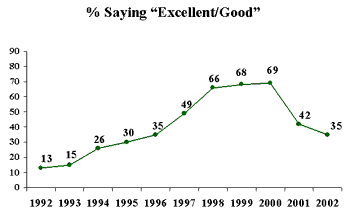 |
The average rating of the economy so far this year has been 35%, which is slightly below the overall average for the last decade. The current July reading of 28% is at the low end of the spectrum for this year, but is not yet at the very low end seen in the early 1990s.
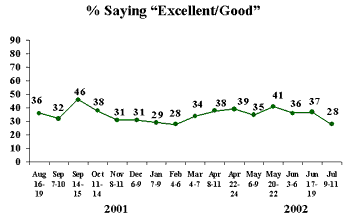
The month-by-month pattern since last September is presented below:
| Rating of Current Economic
Conditions: August 2001 – July 2002 |
 |
Major points:
- There was a brief uptick in the public's ratings of the economy immediately after Sept. 11, but the ratings fell back.
- There was a slight increase in positivity in April and May, but that too has fallen back.
Economic Optimism
We measure the economic optimism of the public using a separate question: "Right now, do you think that economic conditions in the country as a whole are getting better or getting worse?"
We have asked this question in nine out of the last 12 years. (It was not asked in 1993, 1994 and 1995.) The range of responses, summarized by subtracting the percentage saying the economy is getting worse from the percentage saying the economy is getting better, is very large, extending from a –33 in 1991 to a +28 in 2000. Across the nine yeas, the average has been zero. That is, Americans have tended to be just about as optimistic as pessimistic over the last decade.
| Economy -- Getting Better or Getting Worse? |
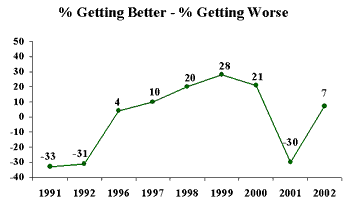 |
Note the public's substantial recognition in 2001 that the economy was getting worse -- with an average net difference between the positive and negative view of –30%.
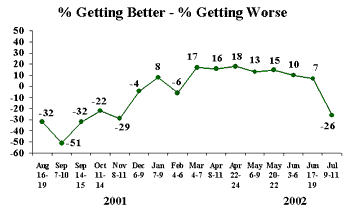
But this year the public became more optimistic. The overall average on this index for the year -- so far -- has been a net plus, at +7. This suggests in broad terms that the public was set for and anticipating a recovery. But by last week, the net index value was down to a –26, which is closer to the most negative yearly averages we have measured.
| Economy – Getting Better or
Getting Worse? August 2001 – July 2002 |
 |
Satisfaction With the Way Things are Going
We can also look at a broader measure that asks Americans to summarize their overall feelings about the state of the nation: "In general, are you satisfied or dissatisfied with the way things are going in the United States at this time?"
This summary measure asks the respondent to do an internal averaging of sorts, based on whatever he or she deems to be important in gauging their overall assessment of the state of the nation. The response to this measure provides a basic indicator of the nation's mood.
The public has been assessed on this satisfaction measure a total of 131 times since its inception in February 1979. There were no measures in 1980, but otherwise we have a database that extends across 24 years. (Since October 2000, readings on this measure have been routinized to the first or second week of every month.)
The average yearly rating across the 23 years is 43%. The highest yearly satisfaction averages occurred in 1986, 1998, and 2000, when the rating was 60%. The lowest yearly average was 19% in 1979.
| Satisfaction in America: Yearly Averages 1979-2002 |
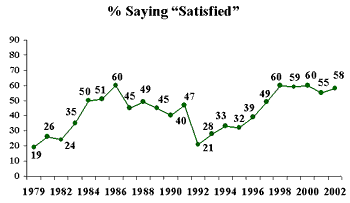 |
In 2002, the yearly average so far is a perhaps surprisingly high 58%, reflecting in large part a continuation of the rally effect that resulted in increases in a number of mood measures after Sept. 11. The current rating for July is 49%, which remains slightly above average, but is significantly below this year's overall average. The curve for the month by month measures since October 2000 shows a pattern with three distinct phases: a downward curve up through Sept. 7-10, an upward tilt, and now, over the last three months, a downward slope.
Still, as noted, the current satisfaction level remains above average for the past quarter century. And the level of satisfaction for the year, so far, is significantly above average.
Discussion
There is little question that our measures of the public's rating of the economy and the public's overall satisfaction levels are trending down, and that this July's reading of economic optimism in particular signifies a sharp drop.
It is important to put these findings in context. There have been several significant inflection points over the past decade. First, public opinion on many mood measures soared during the boom years of 1999 and 2000. These years provide a comparative benchmark against which many opinion measures are going to look anemic in the years to come. Second, after a substantial decline in most mood and economic measures in the first nine months of 2001, the terrorist attacks of Sept. 11 provided the catalyst for an extraordinary rallying of public opinion on some measures. This rally was based not on the economy, but on the strengthening of internal solidarity that often comes with an external threat. Third, we began earlier this year to pick up an increase in public optimism about the economy.
So what we are finding now is in some ways a return to the mood and perceptions of the economy that existed in the spring and summer of 2001 -- which in turn were down very substantially from the peaks of 1999 and 2000.
The important question focuses on the weeks and months ahead. The rally in mood we picked up earlier this year has been aborted. Will the public's assessment of the overall situation in the country continue to sink, or have we now reached a bottom point after which the rally will begin again?
Finally, we should note that, as is usually the case, the local perspective on the economy looks better than the national perspective. People are more positive about their personal financial situation than they are the national economy. Workers in particular are much more positive about their own companies and management than they are about the leaders of other companies or about the national economy.
Survey Methods
These results are based on telephone interviews with a randomly selected national sample of 1,004 adults, 18 years and older, conducted July 9-11, 2002. For results based on this sample, one can say with 95 percent confidence that the maximum error attributable to sampling and other random effects is plus or minus 3 percentage points. In addition to sampling error, question wording and practical difficulties in conducting surveys can introduce error or bias into the findings of public opinion polls.
