The most recent CNN/USA Today/Gallup poll shows that more than 7 in 10 Americans predict that Hillary Clinton will run for president someday. Despite her assertions that she has no plans to run, Gallup polling indicates that she would be the overwhelming favorite for the Democratic presidential nomination in 2004 if she did. All of this is to say that there is a real possibility that a woman could head a major party ticket in the foreseeable future.
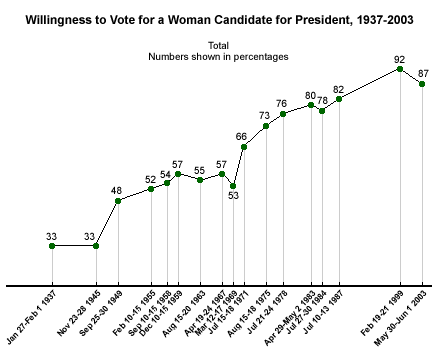
Over the years, Gallup polling has shown an increased acceptance of the concept of a female presidential candidate. In fact, 87% of Americans now say they would vote for a woman if their party nominated a qualified one for president. Although this percentage is down slightly from 1999, it is overwhelmingly higher than when Gallup first asked about this in 1937.At that time, only one in three Americans said they would vote for a woman for president "if she were qualified in every other respect" (no party qualification was made in 1937-1945).

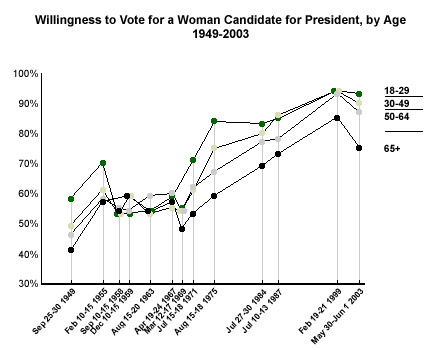
But the data also suggest that some Americans are less supportive of a female president than others, even if a solid majority of Americans from all backgrounds support the idea. Some of the largest differences are by age. In the most recent asking, from a May 30-June 1 poll, support for a woman president was 75% among those age 65 and older, but close to 90% among all other age groups.
While members of all age groups show increasing support for a female presidential candidate over time, the age gap has undergone a transformation of its own.

In the immediate post-World War II period, younger people were more likely than older people to support the idea of a woman president. But from the late 1950s through the early 1960s, there were hardly any age differences -- all showing majorities in favor, but still about 4 in 10 opposed.
By 1971, during the second wave of feminism, all age groups -- but especially the youngest one -- showed increases in support for a woman president. However, support grew more slowly among the oldest age group. By the end of the century (1999), all age groups expressed overwhelming support, though the oldest group (65+) still lagged by several points behind people under age 65.
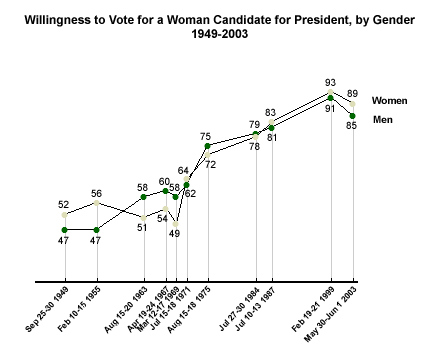
No Gender Gap Evident
Over this period of time, there has never been a gender gap on this issue that exceeded nine points. In the mid-1950s, women were more likely to support a female president than men were (56% to 47%). But in three polls conducted in the 1960s, men tended to be more supportive than women. In 1969, for example, men were more supportive of a woman president than women were by 58% to 49%. Since that period there has not been more than a four-point difference between men and women, including the latest poll in which 85% of men and 89% of women said they would vote for a generally well-qualified woman for president.

Bottom Line
While most groups in American society are becoming more accepting of the idea of a woman in the White House, some groups are slower to endorse this idea than others are. As time passes and generations change, one would expect support for a woman president to be nearly unanimous. The data suggest that the women's movement of the late 1960s may have helped to change many Americans' minds as to a woman's ability to hold the highest office in the land. In addition to that, for many younger Americans, the idea of a woman making significant contributions in the workplace and the political arena may seem very normal. However, apparently many of those who grew up in an era when women primarily took care of the home have still not gotten used to the idea of a woman in the White House.
