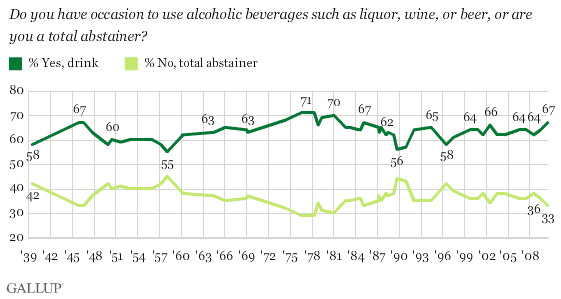
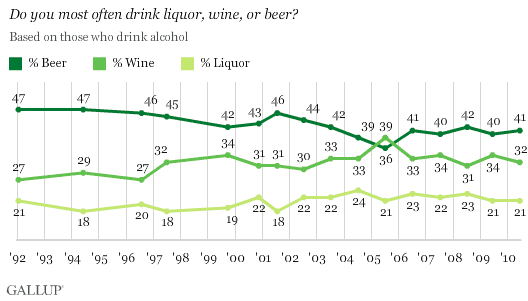
PRINCETON, NJ -- Sixty-seven percent of U.S. adults drink alcohol, a slight increase over last year and the highest reading recorded since 1985 by one percentage point. Beer remains the favorite beverage among drinkers, followed by wine and then liquor.

Despite some yearly fluctuations, the percentage of Americans who say they drink alcohol has been remarkably stable over Gallup's 71 years of tracking it. The high point for drinking came in 1976-1978, when 71% said they drank alcohol.
The low of 55% was recorded in 1958. When Gallup first asked Americans about drinking, in the waning days of the Great Depression in 1939, 58% of adults said they were drinkers.
A majority of Americans in most demographic subgroups of the population drink, though in some groups drinking is more prevalent than in others. One of the most significant predictors of alcohol consumption is church attendance. Those who seldom or never attend church are substantially more likely than more frequent church attenders to say they drink; and those who have no religious identity, Catholics, and non-Christians are more likely to drink than Protestants.
Medical research shows that moderate drinking is associated with a lower probability of heart trouble, and Gallup has recently confirmed that the incidence of heart attacks increases substantially with age. Still, the data indicate that many older Americans are not taking advantage of the prophylactic benefit of drinking; 59% of older Americans drink alcohol, substantially lower than the percentages among those who are younger. Additionally, those with the lowest education levels and lowest incomes are less likely to drink than others.

Beer Remains Dominant as Preferred Beverage
Beer remains the preferred beverage of choice among Americans who drink alcohol, as it has every year since 1992 -- with the exception of 2005, when wine edged into the top spot.

Beer's popularity has slipped slightly over the years. In 1992 and 1994, 47% of drinkers named it as their preferred drink, compared with 41% this year.
Beverage preferences vary widely across demographic groups, with beer most preferred among men, younger drinkers, and those in the Midwest. Wine ranks as the preferred beverage among women and older Americans.

Men under 50 are among those who most strongly prefer beer, which does not come as a surprise to those who observe the preponderance of beer ads embedded in sports and other programming aimed at young men. Older women are the biggest fans of wine, while roughly equal numbers of women under 50 choose wine and beer.
The older skew in preference for wine is starkly apparent when one looks at drinkers aged 18 to 34, who are highly likely to choose beer as their preferred beverage, and among whom wine is slightly behind even liquor. By contrast, drinkers 55 and older clearly choose wine as their preferred beverage.
Although beer is the top choice in all four major regions of the country, residents on the two coasts are somewhat more likely to prefer wine than are those living elsewhere. Beer remains most popular in the Midwest.
Editor's note: This article reflects a revised headline. The original version stated that the U.S. drinking rate was at a 15-year high.
Results for this Gallup poll are based on telephone interviews conducted July 8-11, 2010, with a random sample of 1,020 adults, aged 18 and older, living in the continental U.S., selected using random-digit-dial sampling.
For results based on the total sample of national adults, one can say with 95% confidence that the maximum margin of sampling error is ±4 percentage points.
For results based on the sample of 685 adults who drink alcoholic beverages, the maximum margin of sampling error is ±4 percentage points.
Interviews are conducted with respondents on landline telephones (for respondents with a landline telephone) and cellular phones (for respondents who are cell phone-only). Each sample includes a minimum quota of 150 cell phone-only respondents and 850 landline respondents, with additional minimum quotas among landline respondents for gender within region. Landline respondents are chosen at random within each household on the basis of which member had the most recent birthday.
Samples are weighted by gender, age, race, education, region, and phone lines. Demographic weighting targets are based on the March 2009 Current Population Survey figures for the aged 18 and older non-institutionalized population living in continental U.S. telephone households. All reported margins of sampling error include the computed design effects for weighting and sample design.
In addition to sampling error, question wording and practical difficulties in conducting surveys can introduce error or bias into the findings of public opinion polls.
View methodology, full question results, and trend data.
For more details on Gallup's polling methodology, visit https://www.gallup.com/.
