WASHINGTON, D.C. -- Seventeen percent of U.S. workers say they work for federal, state, or local government, ranging from 38% in Washington, D.C., to 12% in Ohio. More than a quarter of workers in Washington, D.C., Alaska, Virginia, and Maryland work for government, as do upwards of 15% in the vast majority of states.
The findings reflect interviews with 98,755 adults, employed full time or part time, conducted Jan. 2-June 30, 2010, as part of Gallup Daily tracking. Gallup asks employed Americans first if they work for the government, then whether they work for federal, state, or local government.
The five states with the highest percentage of government workers also have the highest percentage of federal workers, which is much of what sets them apart from the rest of the nation.
The U.S. Postal Service is the nation's top federal employer, according to the Bureau of Labor Statistics, accounting for 23% of government jobs across the country.
The U.S. military is another major government employer, with bases spread throughout the nation, including in several of the states with high percentages of government workers. North Carolina, for example, is home to Ft. Bragg, one of the nation's largest U.S. military bases. A separate Gallup question confirms that many of these states with high government employment, including Alaska, Hawaii, Virginia, Oklahoma, and New Mexico, have above-average percentages of active duty military.
Other federal government jobs likely to be geographically dispersed include work in the U.S. justice system, agriculture, homeland security, transportation, and the administration of health services, such as Medicare and Medicaid.
Alaska and Hawaii, along with South Carolina, have the highest percentages of state government workers (11%). In general, however, the percentages of state and local workers are in the single digits. State workers vary widely by profession, and include, for example, correctional officers, while local government workers include teachers, firefighters, and police.
The Midwest stands out clearly as the region with the smallest proportions of government workers, though they still make up at least 12% of workers in every state.
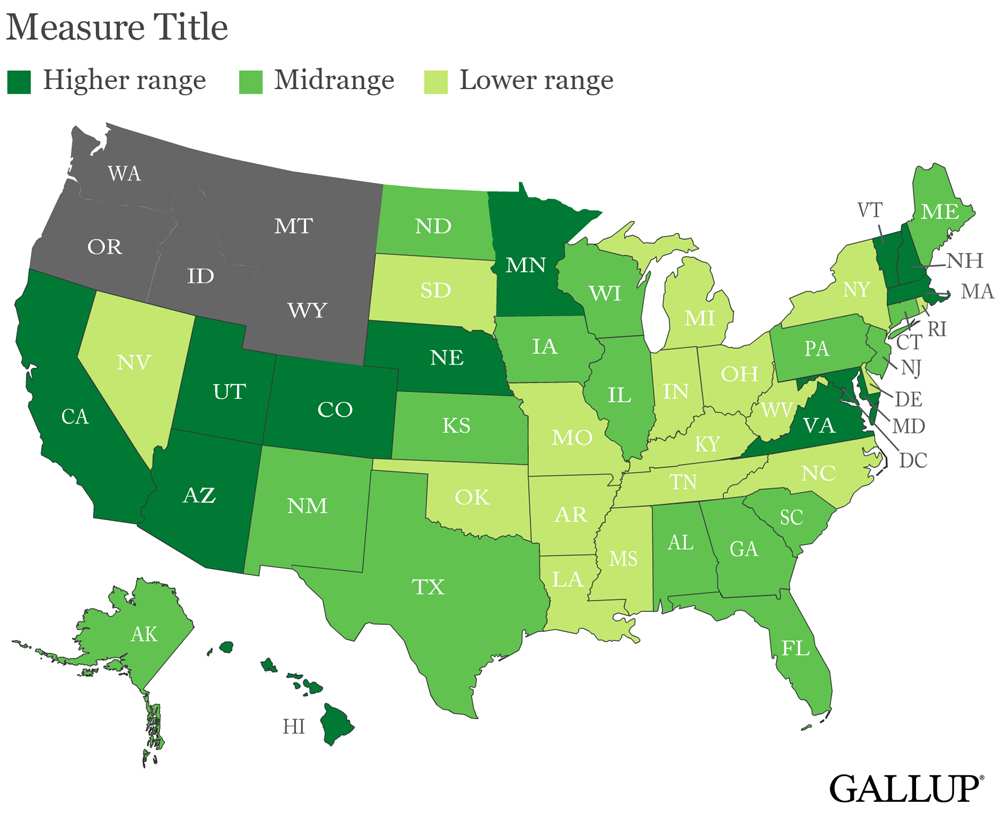
Gallup has found more job creation in the federal government than in the private sector, but the government employment results do not show a strong relationship to Gallup's Job Creation Index. While the four states with the highest percentage of government workers also have some of the best job markets, other states with high government employment do not fare as well. Nevada, for example, ranks last in Gallup's Job Creation Index despite having higher-range government employment. And Pennsylvania has one of the best job markets despite having lower-range government employment.
Together, the data showcase the dispersion of government workers across the nation. While Washington, D.C., has by far the most government workers, no less than 12% of workers in any U.S. state report working for the government. The findings underscore the extent to which government employment represents a crucial part of the U.S. economy. The potential for growth and for contraction within key sectors of the federal government, along with cutbacks in state and local government, have clear implications for the U.S. employment picture overall -- and far beyond the nation's capital.
This story is the "Readers' Pick" in a series of 2010 midyear updates released as part of Gallup's State of the States series. Gallup.com will report new full-year totals in early 2011 based on all 2010 surveys.
Survey Methods
Results are based on telephone interviews conducted as part of Gallup Daily tracking Jan. 1-June 30, 2010, with a random sample of 98,755 adults employed full or part time, aged 18 and older, living in all 50 U.S. states and the District of Columbia, selected using random-digit-dial sampling.
For results based on the total sample of workers, one can say with 95% confidence that the maximum margin of sampling error is ±1 percentage point.
The margin of sampling error for most states is ±3 to ±4 percentage points, but is as high as ±8 percentage points for the District of Columbia and ±7 percentage points for smaller states such as Wyoming, North Dakota, South Dakota, Delaware, and Hawaii.
Interviews are conducted with respondents on landline telephones and cellular phones, with interviews conducted in Spanish for respondents who are primarily Spanish-speaking. Each daily sample includes a minimum quota of 150 cell phone respondents and 850 landline respondents, with additional minimum quotas among landline respondents for gender within region. Landline respondents are chosen at random within each household on the basis of which member had the most recent birthday.
Samples are weighted by gender, age, race, Hispanic ethnicity, education, region, adults in the household, cell phone-only status, cell phone-mostly status, and phone lines. Demographic weighting targets are based on the March 2009 Current Population Survey figures for the aged 18 and older non-institutionalized population living in U.S. telephone households. All reported margins of sampling error include the computed design effects for weighting and sample design.
In addition to sampling error, question wording and practical difficulties in conducting surveys can introduce error or bias into the findings of public opinion polls.
For more details on Gallup's polling methodology, visit www.gallup.com.