PRINCETON, NJ -- Democratic House Speaker Nancy Pelosi's favorable rating is down seven percentage points since May to 29%, a new low for her since assuming the top congressional post.

Pelosi's ratings were 2-to-1 positive, 44% to 22%, when she first assumed the speakership in January 2007, but they became closely divided by March of that year and remained so in November 2008. Views became more negative than positive for the first time in the first half of 2009, possibly because of Pelosi's public stance against the CIA's use of "enhanced interrogation" of terrorist suspects at Guantanamo Bay prison, and her dispute with the CIA over whether she had been briefed on the matter. Spanning the period these issues were in the news, her favorable rating fell from 42% to 32%. Pelosi's favorable rating recovered slightly in the first half of 2010 to 36%, but it has since tumbled to the new low.
Independents in particular have become more negative about Pelosi, with her favorability dwindling nine points among this group since May, to 21%. Nearly 6 in 10 independents (58%) now view her unfavorably, compared with 86% of Republicans and 22% of Democrats.

Pelosi's negative image is apparently not simply a reflection of Americans' dissatisfaction with the leadership in Washington, or with the economic climate more generally. President Obama's favorable rating has also declined (the new figure will be released later this week), but continues to register well above Pelosi's.
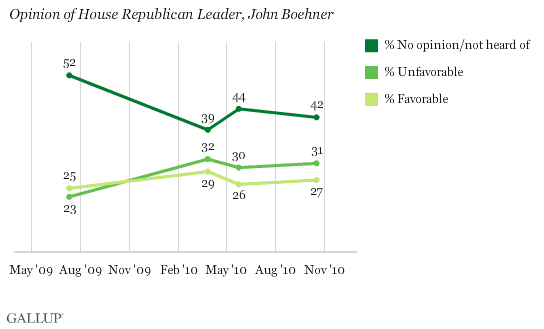
The new poll also finds Pelosi significantly more unpopular with Americans than House Republican Leader John Boehner. Boehner is less well-known than Pelosi (58% of Americans have an opinion of him compared with 85% for Pelosi), but among those who know him, Boehner's image is generally balanced: 27% view him favorably vs. 31% unfavorably.
Boehner's ratings are largely unchanged this year, although they are slightly more negative now than in 2009 as he has become more familiar to Americans.

Pelosi is still more popular than former House Speaker Newt Gingrich was at his lowest point, however just barely. Gingrich's worst favorable rating was recorded in April 1997, when 24% of Americans viewed him favorably and 62% unfavorably.
It should be noted that Pelosi had a lower favorable rating in 2003 (23%) than she does currently, but that was at a time when the majority of Americans were not familiar with her, and her unfavorable rating was also low -- registering 18% to 19%. The net view of Pelosi today is -27 (her favorable minus unfavorable ratings), worse than any prior reading on her.
Bottom Line
Pelosi's image has gone from bad to worse in recent months, with independents, in particular, growing more critical of her. Her resulting 2-to-1 negative to positive image presents a challenge for congressional Democrats as they try to convince voters to send them back to Washington for another term. While President Obama may be of some benefit on the campaign trail in terms of firing up the Democratic base to turn out, Pelosi's subdued favorability among Democrats and highly negative image among independents suggest she is a far riskier person for Democratic candidates to be associated with -- something Republicans who are using her in ads against their opponents have already concluded.
Learn more about Gallup's likely voter models for the 2010 midterm congressional elections.
Survey Methods
Results for this Gallup poll are based on telephone interviews conducted Oct. 14-17, 2010, with a random sample of 1,029 adults, aged 18 and older, living in the continental U.S., selected using random-digit-dial sampling.
For results based on the total sample of national adults, one can say with 95% confidence that the maximum margin of sampling error is ±4 percentage points.
Interviews are conducted with respondents on landline telephones (for respondents with a landline telephone) and cellular phones (for respondents who are cell phone-only). Each sample includes a minimum quota of 150 cell phone-only respondents and 850 landline respondents, with additional minimum quotas among landline respondents for gender within region. Landline respondents are chosen at random within each household on the basis of which member had the most recent birthday.
Samples are weighted by gender, age, race, education, region, and phone lines. Demographic weighting targets are based on the March 2009 Current Population Survey figures for the aged 18 and older non-institutionalized population living in continental U.S. telephone households. All reported margins of sampling error include the computed design effects for weighting and sample design.
In addition to sampling error, question wording and practical difficulties in conducting surveys can introduce error or bias into the findings of public opinion polls.
View methodology, full question results, and trend data.
For more details on Gallup's polling methodology, visit https://www.gallup.com/.
