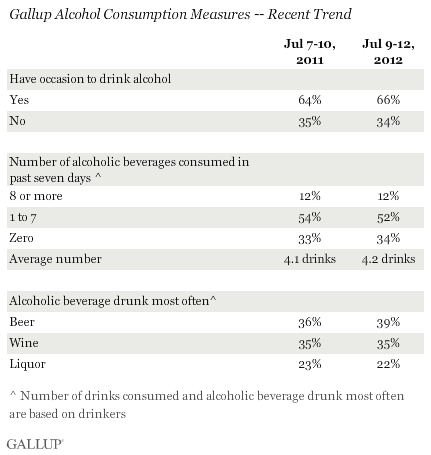
PRINCETON, NJ -- Americans' drinking habits held steady in the past year, with 66% saying they consume alcohol and drinkers consuming just over four alcoholic drinks per week, on average. Beer continues to be Americans' preferred drink, although wine remains a close second, with liquor favored by 22%.

The findings are from Gallup's annual Consumption Habits poll, conducted July 9-12. Although 66% of Americans say they "have occasion to drink alcoholic beverages such as liquor, wine, or beer," a third of these say they had no drinks in the seven days prior to the survey. This leaves roughly four in 10 Americans (44%) who appear to be regular drinkers, consuming at least one alcoholic beverage in the past week.
While only 12% of drinkers report consuming eight or more drinks in the past week -- averaging more than one per day -- Gallup finds 22% of drinkers saying they sometimes drink too much. This is up from 17% last year, but similar to the percentages in most other years over the past decade. Prior to 2001, the proportion tended to be higher.

Drinking Rates Higher Among Men Than Women, Whites Than Nonwhites
Drinking habits vary considerably by gender, race, and age. While roughly equal proportions of men and women say they ever have occasion to drink, men tend to drink more. Specifically, men who drink report consuming 6.2 drinks, on average, in the past week, compared with the 2.2 drinks consumed by women. Also, nearly three in 10 male drinkers admit they sometimes consume more alcohol than they think they should, versus 14% of female drinkers.
Not only are whites more likely to drink than nonwhites, but white drinkers report consuming more alcohol than nonwhites -- 4.5 drinks on average in the past week among whites, compared with 3.3 among nonwhites.
Younger adults drink more than older adults and, as a result, men aged 18 to 49 are the heaviest drinkers of any age/gender group. The sharpest differences are seen in self-reported overdrinking, with 36% of younger men admitting they sometimes drink too much, compared with 18% of older men, 20% of younger women, and 8% of older women.

Men Still Prefer Beer; Women Still Prefer Wine
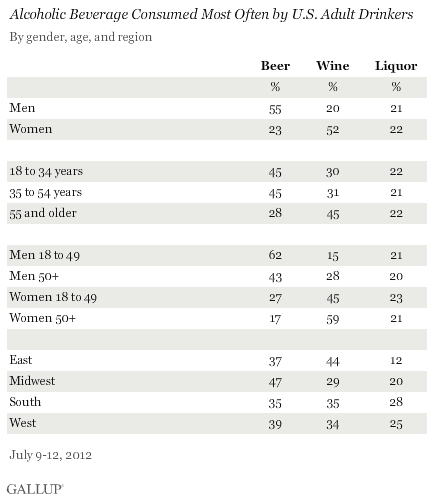
The slight majority of male drinkers, 55%, say they most often drink beer, followed by liquor and wine at 21% and 20%, respectively. Female drinkers have an equally strong preference for wine, with 52% saying they most often drink wine and just over 20% favoring either liquor or beer.
Beer is the beverage of choice among both 18- to 34-year-olds and those aged 35 to 54, while adults aged 55 and older lean more toward wine.
Additionally, drinkers in the Midwest show the greatest preference for beer, while those in the East are the most likely to drink wine, as Gallup has found in prior years.

Bottom Line
Drinking is commonplace in the U.S., with two-thirds of Americans saying they ever drink alcohol, and just over 40% reporting that they had at least one drink in the past week. Drinkers still show a slight preference for beer, but wine is not far behind.
With drinking comes overdrinking, and despite possible reluctance by some respondents to admit problems, one in five drinkers -- representing 14% of all U.S. adults -- say they sometimes drink too much. The rates are particularly high among men and younger adults, making younger men the most at risk for this behavior.
Survey Methods
Results for this Gallup poll are based on telephone interviews conducted July 9-12, 2012, with a random sample of 1,014 adults, aged 18 and older, living in all 50 U.S. states and the District of Columbia.
For results based on the total sample of national adults, one can say with 95% confidence that the maximum margin of sampling error is ±4 percentage points.
For results based on the sample of 676 adults who drink alcoholic beverages, the maximum margin of sampling error is ±5 percentage points.
Interviews are conducted with respondents on landline telephones and cellular phones, with interviews conducted in Spanish for respondents who are primarily Spanish-speaking. Each sample includes a minimum quota of 400 cell phone respondents and 600 landline respondents per 1,000 national adults, with additional minimum quotas among landline respondents by region. Landline telephone numbers are chosen at random among listed telephone numbers. Cell phone numbers are selected using random-digit-dial methods. Landline respondents are chosen at random within each household on the basis of which member had the most recent birthday.
Samples are weighted by gender, age, race, Hispanic ethnicity, education, region, adults in the household, and phone status (cell phone only/landline only/both, cell phone mostly, and having an unlisted landline number). Demographic weighting targets are based on the March 2011 Current Population Survey figures for the aged 18 and older non-institutionalized population living in U.S. telephone households. All reported margins of sampling error include the computed design effects for weighting and sample design.
In addition to sampling error, question wording and practical difficulties in conducting surveys can introduce error or bias into the findings of public opinion polls.
View methodology, full question results, and trend data.
For more details on Gallup's polling methodology, visit www.gallup.com.
