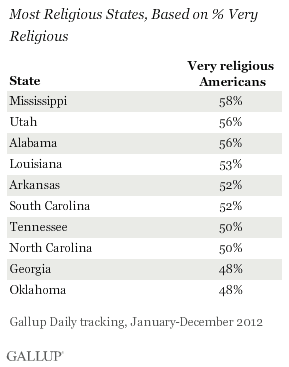
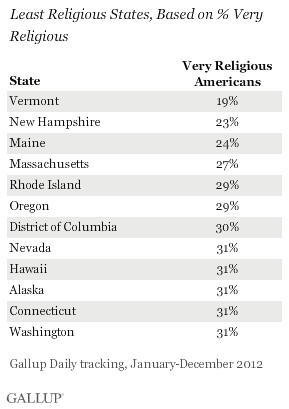
PRINCETON, NJ -- Mississippi remained the most religious state in the union in 2012, with 58% of its residents classified as very religious. At the other end of the spectrum, Vermont remained the least religious state, with 19% of its residents classified as very religious.


These state-by-state results are based on more than 348,000 interviews conducted as part of Gallup Daily tracking in 2012, including more than 1,000 interviews conducted in all but two states and the District of Columbia. Complete results and sample sizes are on Page 2.
Overall, 40% of Americans nationwide were classified as very religious in 2012 -- based on saying religion is an important part of their daily life and that they attend religious services every week or almost every week. Thirty-one percent of Americans were nonreligious, saying religion is not an important part of their daily life and that they seldom or never attend religious services. The remaining 29% of Americans were moderately religious, saying religion is important in their lives but that they do not attend services regularly, or that religion is not important but that they still attend services.
The 2012 nationwide proportions of very religious, moderately religious, and nonreligious Americans are all within one percentage point of where they were in 2011. Underscoring this stability, a comparison of the top 10 religious states in 2012 with those in 2011 shows no change -- either in the states that constitute the top 10 or in their rank order. The group of states categorized as least religious was almost as constant between 2011 and 2012. The only change other than minor rank-order differences is the inclusion of Hawaii in the least religious list this year in place of New York.
Eight of the top 10 religious states are in the South -- basically comprising the entire Southern belt from Georgia and the two Carolinas on the Atlantic coast through Tennessee, Alabama, and Mississippi, to Louisiana and Arkansas in the west. The states outside the Southern belt are Utah -- with its strongly religious majority Mormon population -- and Oklahoma, which straddles the border between the South and the Midwest.
The 12 least religious states comprise the entirety of New England -- Maine, New Hampshire, Vermont, Massachusetts, Rhode Island, and Connecticut -- along with the three most Northwestern states in the union, Alaska, Washington, and Oregon, plus the District of Columbia, Nevada, and Hawaii.
Implications
America remains a religious nation -- with about seven in 10 Americans classified as very or moderately religious -- but these patterns of religion are quite varied across the regions of the country. Southern states and Utah are the most religious areas in the nation, while New England states and those in the far Northwest are the least religious. There has been little change in these patterns over the past year.
There are a number of explanations for the substantial differences in religiousness across the states of the union, but analysis included in the recent book God Is Alive and Well shows that the differences are not accounted for by state demographics such as race and ethnicity, or -- with the exception of Utah -- by the type of religion that predominates in each state. More likely the differences reflect regional cultural traditions.
The posited existence of state cultures of religion suggests that migrants who cross state lines could be socialized into the religious patterns of the states to which they move. In other words, it can be hypothesized that a person moving to Mississippi is more likely to become personally more religious than if that same person moved to Vermont. Some evidence suggests there has been more migration to religious states than to nonreligious states over the past decade or so. If that is the case, and if it continues, it's possible that this will effectively increase the overall level of religiosity in the nation, or at least moderate a decrease in religiousness.
Gallup's "State of the States" series reveals state-by-state differences on political, economic, and well-being measures Gallup tracks each day. New stories based on full-year 2012 data will be released throughout the month of February.
Survey Methods
Results for this Gallup poll are based on telephone interviews conducted Jan. 1-Dec. 31, 2012, on the Gallup Daily tracking survey, with a random sample of 348,306 adults, aged 18 and older, living in all 50 U.S. states and the District of Columbia.
For results based on the total sample of national adults, one can say with 95% confidence that the margin of sampling error is ±1 percentage point.
Margins of error for individual states are no greater than ±6 percentage points, and are ±3 percentage points in most states. The margin of error for the District of Columbia is ±6 percentage points.
Interviews are conducted with respondents on landline telephones and cellular phones, with interviews conducted in Spanish for respondents who are primarily Spanish-speaking. Each national sample includes a minimum quota of 400 cell phone respondents and 600 landline respondents per 1,000 national adults, with additional minimum quotas among landline respondents by region. Landline telephone numbers are chosen at random among listed telephone numbers. Cell phones numbers are selected using random digit dial methods. Landline respondents are chosen at random within each household on the basis of which member had the most recent birthday.
State samples are weighted to be representative of the state's adult population by gender, age, race, Hispanic ethnicity, and education based on the March 2012 Current Population Survey. All reported margins of sampling error include the computed design effects for weighting.
In addition to sampling error, question wording and practical difficulties in conducting surveys can introduce error or bias into the findings of public opinion polls.
For more details on Gallup's polling methodology, visit www.gallup.com.

