PRINCETON, NJ -- Fifty-nine percent of Americans get seven or more hours of sleep at night, while 40% get less than seven hours. Those figures are largely unchanged from Gallup polls in the 1990s and 2000s, but Americans, on average, slept much more in the 1940s. Americans currently average 6.8 hours of sleep at night, down more than an hour from 1942.

Medical studies have related a lack of sleep to health problems and cognitive impairment. Therefore, experts typically recommend seven to nine hours sleep for adults. Currently, 59% of U.S. adults meet that standard, but in 1942, 84% did. That means four in 10 Americans get less than the recommended amount of nightly sleep, compared with the 11% who did so 70 years ago.
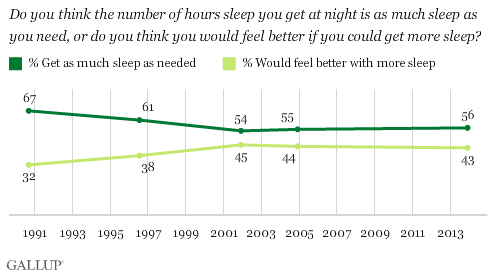
Regardless of what the experts recommend and the number of hours of sleep people actually get, 56% of Americans say they get as much sleep as needed, while 43% say they would feel better if they got more sleep. The percentage who say they get sufficient sleep has been in the mid-50% range since 2001, but was much higher in 1990. Gallup did not ask this question in the 1942 poll.

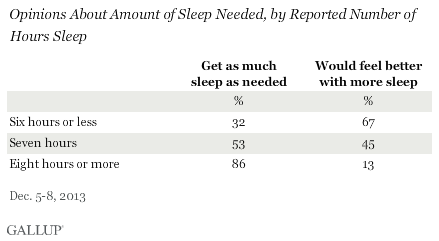
There is a predictable positive relationship between the hours of sleep one reports getting and that individual's opinion about whether he or she gets enough sleep. Thirty-two percent of those who say they sleep six hours or less say they get as much sleep as needed, which rises to 53% among those getting seven hours of sleep -- the minimum recommendation -- and to 86% among those getting eight hours or more.

Older Americans Sleep the Most
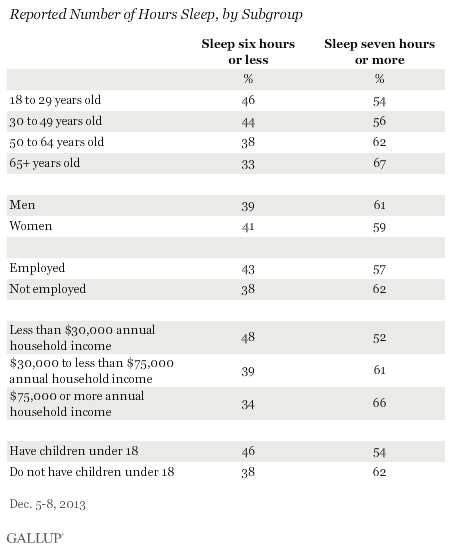
Americans aged 65 and older report getting the most sleep, with 67% getting seven or more hours per night. Each younger age group gets less sleep, down to 54% of 18- to 29-year-olds who report getting seven or more hours. Nearly half of 18- to 29-year-olds get less than the recommended amount of sleep.
Parents of young children and lower-income Americans are two other groups that struggle to get the proper amount of sleep. The difference by income is partially explained by age, as younger Americans are disproportionately in the lower-income category.

Adults Under Age 50 Most Likely to Feel Sleep Deprived
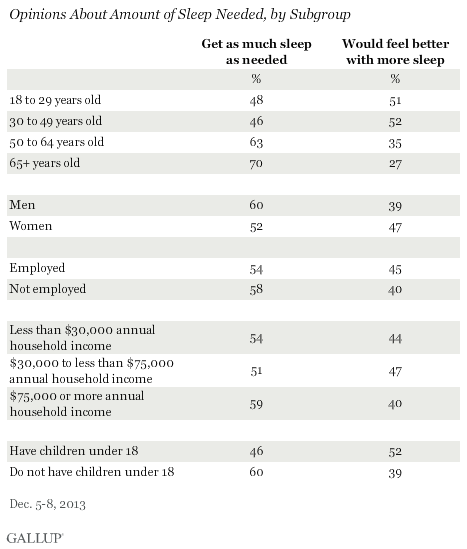
Consistent with their lower average of reported hours sleep per night, younger adults are among those most likely to believe they need more sleep than they are getting. Less than half of Americans under age 50 think they get as much sleep as they need, compared with 63% of those between the ages of 50 and 64, and 70% of those aged 65 and older.
Parents of young children are another group that tends to feel sleep-deprived -- 46% think they get as much sleep as needed.

Implications
U.S. adults likely get less sleep than would be ideal, with the average reported 6.8 hours below the minimum recommendation of seven hours per night. Forty percent get six hours sleep or less per night. That is a major shift from 1942, at which time the vast majority of American adults were sleeping seven hours or more per night.
Even though many Americans sleep less now than they ideally should, the majority, 56%, say they get as much sleep as they need, although this is also down from what Gallup measured in the 1990s.
Young adults and parents of children under 18 are among the more sleep-deprived groups, while senior citizens tend to be well-rested. Clearly, this is on account of lifestyle, in terms of the demands of working and parenting. Thus, younger Americans who are not getting enough sleep now can look forward to getting more rest as they age and their life situation changes.
Those changes in sleep patterns throughout the life span could lead to changes in Americans' average sleep in the coming years as the baby boomer generation increasingly reaches retirement age. With baby boomers making up such a large share of the U.S. population, more sleep among this group could push the sleeping averages among all Americans higher in the coming years.
Survey Methods
Results for this Gallup poll are based on telephone interviews conducted Dec. 5-8, 2013, with a random sample of 1,031 adults, aged 18 and older, living in all 50 U.S. states and the District of Columbia.
For results based on the total sample of national adults, the margin of sampling error is ±4 percentage points at the 95% confidence level.
Interviews are conducted with respondents on landline telephones and cellular phones, with interviews conducted in Spanish for respondents who are primarily Spanish-speaking. Each sample of national adults includes a minimum quota of 50% cellphone respondents and 50% landline respondents, with additional minimum quotas by region. Landline and cellphone numbers are selected using random-digit-dial methods. Landline respondents are chosen at random within each household on the basis of which member had the most recent birthday.
Samples are weighted to correct for unequal selection probability, nonresponse, and double coverage of landline and cell users in the two sampling frames. They are also weighted to match the national demographics of gender, age, race, Hispanic ethnicity, education, region, population density, and phone status (cellphone only/landline only/both, and cellphone mostly). Demographic weighting targets are based on the March 2012 Current Population Survey figures for the aged 18 and older U.S. population. Phone status targets are based on the July-December 2011 National Health Interview Survey. Population density targets are based on the 2010 census. All reported margins of sampling error include the computed design effects for weighting.
In addition to sampling error, question wording and practical difficulties in conducting surveys can introduce error or bias into the findings of public opinion polls.
View complete question responses and trends (PDF download).
For more details on Gallup's polling methodology, visit www.gallup.com.
