WASHINGTON, D.C. -- Utah remains the state with the lowest percentage of smokers (12.2%), a distinction it has held since Gallup and Healthways began tracking smoking habits in 2008. Kentucky (30.2%) and West Virginia (29.9%) have the highest smoking rates in the nation, as has been the case since 2008.
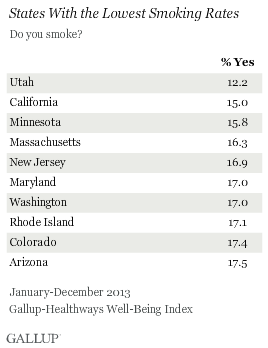
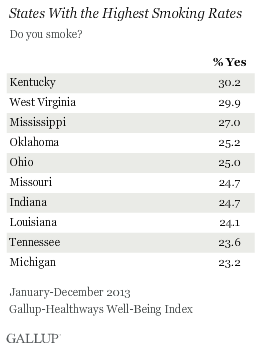
These results are based on interviews conducted Jan. 2-Dec. 29, 2013 with more than 178,000 Americans in all 50 states and the District of Columbia as part of the Gallup-Healthways Well-Being Index.
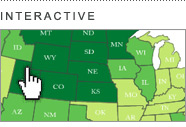 |
| Explore complete state data > |
Utah's low smoking rate is due in large part to the religious composition of its residents. Six in 10 Utah residents identify themselves as Mormon, and in 2013 just 5% of Mormons living in Utah smoked, while smoking among the next three most represented groups in Utah -- those with no religious identity, Protestants, and Catholics -- were at or above national smoking averages for each group.
While smoking rates declined in nearly all states from 2008 -- the first year Gallup and Healthways collected enough data on smoking habits to allow state-level estimates -- to 2013, the states with the top 10 highest and lowest smoking rates are largely the same as they were six years ago. Nationally, the smoking rate fell to 19.7% in 2013 from 21.1% in 2008.
States with the lowest smoking rates are generally located in the Northeast and the West, while states with the highest smoking rates are predominantly located in the South and Midwest.
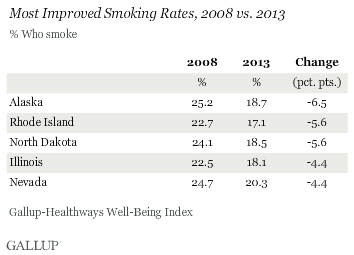
When comparing the 2008 and 2013 smoking rates for each state, Alaska, North Dakota, Rhode Island, Illinois, and Nevada saw the most improvement. The smoking rate in each of these states is at least four percentage points lower in 2013 than it was in 2008, well above the 1.4-point drop nationally.
States With Smoking Bans Tend to Have Lower Smoking Rates
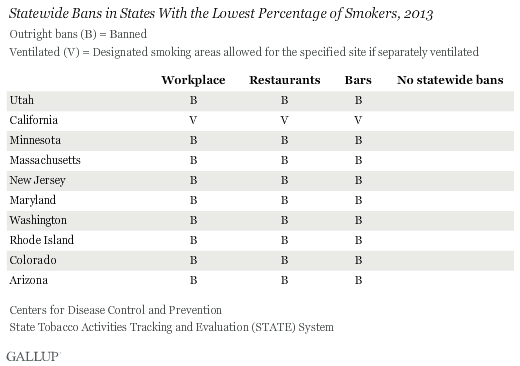
Thirty-three states have outright bans on smoking in private worksites and restaurants, and 27 states have bans on smoking in bars, according to the Centers for Disease Control and Prevention. Some states, like California, have provisions for ventilated rooms. Others, like Missouri, have provisions for designated smoking areas. These figures do not include smoking bans that localities have put in place.
Nine of the 10 states with the lowest smoking rates have outright bans on smoking in all three of these settings, with California allowing for ventilated rooms.
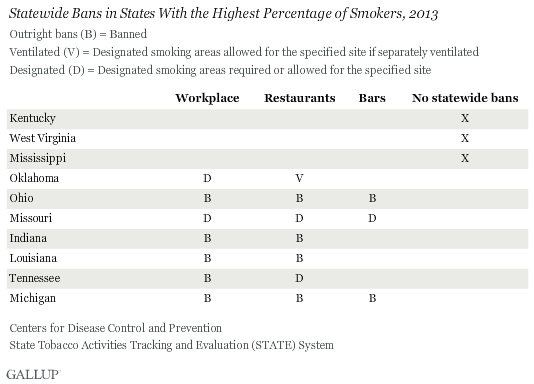
Bans are significantly less common in the 10 states with the highest smoking rates. Kentucky, West Virginia, and Mississippi -- the states with the three highest smoking rates -- do not have statewide bans in any of the three settings.
Bottom Line
Since Gallup began asking Americans whether they smoke or not in 1944, the percentage of smokers has declined by more than half. Still, about one in five Americans in 2013 said they smoke.
There is still wide variation in smoking rates across states; roughly one in three residents in Kentucky and West Virginia are smokers, compared with 12% of residents in Utah. Statewide bans on smoking, or lack thereof, are a strong indicator of where a state ranks relative to the national average.
Notably, in 2013, Gallup found that most smokers want to quit, and the majority have tried to stop, often numerous times. Americans may benefit from state-level, policy-based interventions that would discourage smoking through various laws, bans, and taxes, and may assist residents in quitting through state-run helplines and websites. States that have more comprehensive statewide bans have lower overall smoking rates, although the precise way that these policies affect smoking rates is unclear.
"The past 20 years saw an intense public health push to address tobacco use in the U.S., ranging from legislation around smoke-free zones to the development of pharmaceutical products to leveraging the Internet to drive cessation. However the dramatic loss of state funding for tobacco control across the country could endanger these gains," said Nathan Cobb M.D., Assistant Professor of Medicine at Georgetown University of Medicine and Chief Medical Officer of MeYou Health.
"To pick up the slack will require innovative thinking around social marketing to continue the denormalization of smoking and more cost effective mechanisms to drive cessation and abstinence for those people wishing to quit," Cobb said.
The frontier for future smoking-related debate is widening, however, as e-cigarettes are a new tobacco product that have provoked unchartered legislative battles in states. Corporations, too, are entering the fray with CVS recently deciding that it will eventually end tobacco sales.
Gallup's "State of the States" series reveals state-by-state differences on political, economic, and well-being measures Gallup tracks each day. New stories based on full-year 2013 data will be released in the coming months.
Survey Methods
Results are based on telephone interviews conducted as part of the Gallup-Healthways Well-Being Index survey Jan. 2-Dec. 29, 2013, with a random sample of 178,067 adults, aged 18 and older, living in all 50 U.S. states and the District of Columbia.
For results based on the total sample of national adults, the margin of sampling error is ±1 percentage point at the 95% confidence level.
The margin of sampling error for most states is ±1 to ±2 percentage points, but is as high as ±4 points for states with smaller populations, such as Wyoming, North Dakota, South Dakota, Delaware, and Hawaii.
Interviews are conducted with respondents on landline telephones and cellular phones, with interviews conducted in Spanish for respondents who are primarily Spanish-speaking. Each sample of national adults includes a minimum quota of 50% cellphone respondents and 50% landline respondents, with additional minimum quotas by time zone within region. Landline telephone and cellphone numbers are selected using random-digit-dial methods. Landline respondents are chosen at random within each household on the basis of which member had the most recent birthday.
Samples are weighted to correct for unequal selection probability, nonresponse, and double coverage of landline and cell users in the two sampling frames. They are also weighted to match the national demographics of gender, age, race, Hispanic ethnicity, education, region, population density, and phone status (cellphone only/landline only/both, cellphone mostly, and having an unlisted landline number). Demographic weighting targets are based on the most recent Current Population Survey figures for the aged 18 and older U.S. population. Phone status targets are based on the most recent National Health Interview Survey. Population density targets are based on the most recent U.S. census. All reported margins of sampling error include the computed design effects for weighting.
In addition to sampling error, question wording and practical difficulties in conducting surveys can introduce error or bias into the findings of public opinion polls.
For more details on Gallup's polling methodology, visit www.gallup.com.
