
Story Highlights
- Unemployment is at 6.2%, lowest rate yet measured
- 2014 workforce participation rate remains below previous years
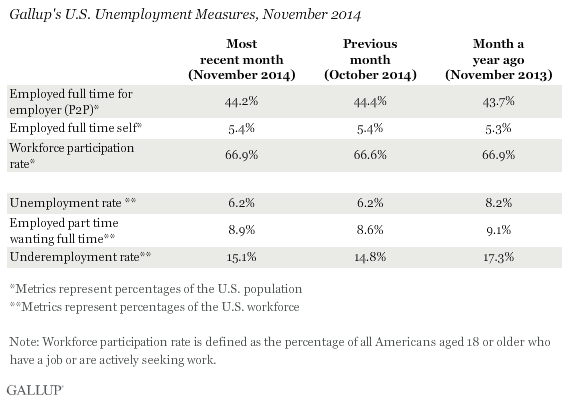
WASHINGTON, D.C. -- The U.S. Payroll to Population employment rate (P2P), as measured by Gallup, was 44.2% in November, statistically similar to the 44.4% measured in October. The percentage of Americans employed full time for an employer has consistently registered at about this level each November since Gallup began tracking P2P in 2010.
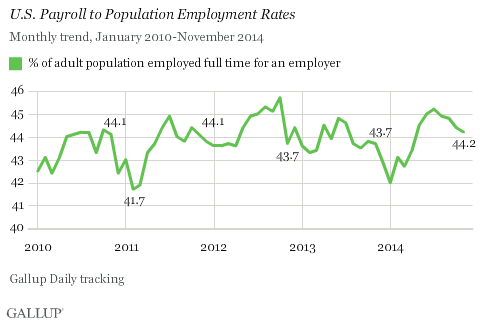
Gallup's P2P metric tracks the percentage of the U.S. adult population aged 18 and older who are employed by an employer for at least 30 hours per week. The latest results are based on Gallup Daily tracking interviews with 29,380 Americans, conducted Nov. 1-30 by landline telephone and cellphone. Gallup does not count adults who are self-employed, work fewer than 30 hours per week, who are unemployed or are out of the workforce as payroll-employed in the P2P metric.
P2P is not seasonally adjusted. However, because of seasonal fluctuations, year-over-year comparisons are often helpful in evaluating whether monthly changes are attributable to seasonal hiring patterns or true growth (or deterioration) in the percentage of people working full time for an employer. The P2P rate in November 2014 is on par with that seen in prior years, down from an earlier high of 45.2% in July 2014 but essentially even with previous November rates.
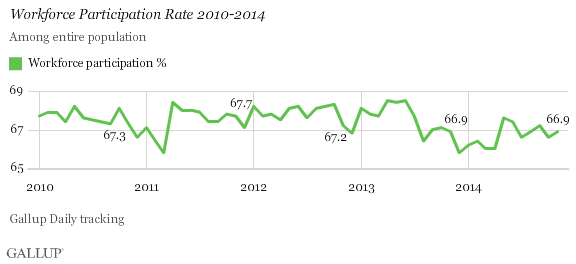
Workforce Participation at 66.9%
Workforce participation among U.S. adults was steady at 66.9% in November, unchanged from 66.6% in October. Workforce participation measures the percentage of adults aged 18 and older who are working, or who are not working but are actively looking for work and are available for employment. The workforce participation rate has ranged narrowly between lows of 65.8% and highs of 68.5% since January 2010.
Unadjusted Unemployment Steady at 6.2%
Gallup's U.S. unemployment rate represents the percentage of adults in the workforce who did not have any paid work in the past seven days, for an employer or themselves, and who were actively looking for and available to work. Gallup's unadjusted U.S. unemployment rate was unchanged at 6.2% in November and continues to be the lowest unemployment rate observed since Gallup began tracking it in January 2010.
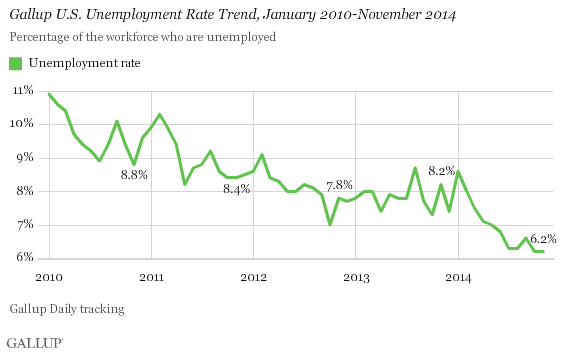
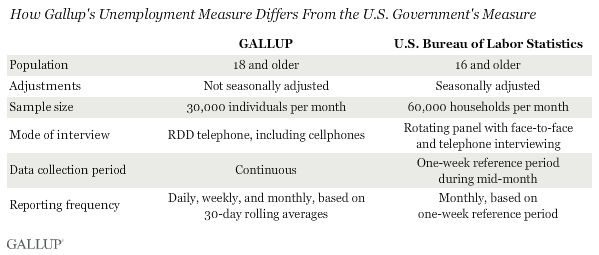
Unlike Gallup's P2P rate, which is a percentage of the total population, traditional employment metrics -- such as the unemployment rates Gallup and the U.S. Bureau of Labor Statistics (BLS) report -- are based on the percentage of the workforce. While both Gallup and BLS data are based on robust surveys, the two have important methodological differences. Additionally, the primary unemployment rate released by the BLS each month is seasonally adjusted. Thus, although Gallup's employment numbers highly correlate with BLS rates, Gallup's numbers tend to have more month-to-month variability, and the unemployment rate as reported by the BLS each month does not always track precisely with the Gallup estimate.
Bottom Line
While this most recent month-to-month difference is not statistically significant, the U.S. P2P rate continued its seasonal decline from the heights of summer. However, continuing low unemployment and steady workforce participation combine to present a strong employment picture relative to the past few years. This pattern has also been reflected in Gallup's Job Creation Index, also near a six-year high, and Americans' ratings of their overall economic confidence.
Gallup.com reports results from these indexes in daily, weekly, and monthly averages and in Gallup.com stories. Complete trend data are always available to view and export in the following charts:
Daily: Employment, Economic Confidence and Job Creation, Consumer Spending
Weekly: Employment, Economic Confidence, Job Creation, Consumer Spending
Read more about Gallup's economic measures.
View our economic release schedule.
Survey Methods
Results for this Gallup poll are based on telephone interviews conducted Nov. 1-30, 2014, on the Gallup U.S. Daily survey, with a random sample of 29,380 adults, aged 18 and older, living in all 50 U.S. states and the District of Columbia. For results based on the total sample of national adults, the margin of sampling error is ±1 percentage points at the 95% confidence level.
Each sample of national adults includes a minimum quota of 50% cellphone respondents and 50% landline respondents, with additional minimum quotas by time zone within region. Landline and cellular telephone numbers are selected using random-digit-dial methods.
Learn more about how the Gallup U.S. Daily works.
