Story Highlights
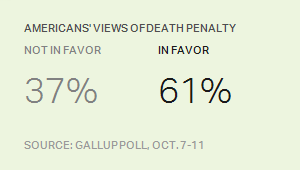
- 61% of U.S. adults favor use of the death penalty
- 37% oppose, higher than in the recent past
- Blacks more likely to oppose death penalty
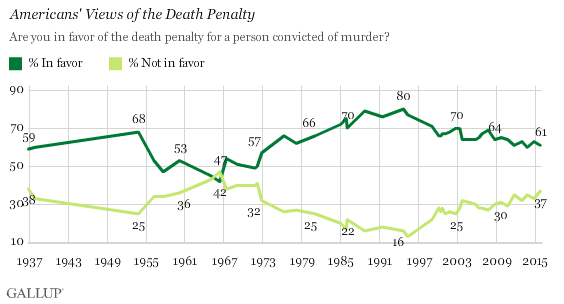
WASHINGTON, D.C. -- About six in 10 Americans favor the use of the death penalty for a person convicted of murder, similar to 2014. This continues a gradual decline in support for the procedure since reaching its all-time high point of 80% in 1994.

Thirty-seven percent oppose the death penalty, slightly higher than in recent years, in part because this year, only 2% of Americans say they have no opinion on the topic.
These results come from Gallup's annual Crime poll, conducted Oct. 7-11, 2015. While the public has, with one exception, favored the death penalty over the 78 years Gallup has asked this question, support for the measure has varied considerably. The low point for support, 42%, came in the 1960s, with support reaching its peak in the mid-1990s and generally declining since that point. Over the past decade, however, there has been minimal fluctuation in the percentage of adults who favor the death penalty, with support always at or above 60%.

This reliably high majority of support belies a powerful current of change in recent years that has rendered the death penalty a far rarer judicial outcome than before. In May, Nebraska became the 19th state (along with D.C.) to ban the death penalty, and the seventh state since 2007. Meanwhile, the number of death sentences issued in 2014 was the lowest since the reinstatement of the punishment in 1976, and the number of executions carried out in 2014 was one of the lowest on record.
Blacks Far Less Likely to Support Death Penalty
A large gulf exists between whites and blacks in their support for the death penalty. In a combined 2014-2015 sample, 68% of whites said they were in favor of the death penalty, while 29% were opposed. Blacks tilt almost as heavily in the opposite direction -- 55% oppose the death penalty, compared with 39% in favor. This pattern is in alignment with previous Gallup findings, including in 2007. The opposition among blacks may be related to the disparity between blacks making up 42% of the current death row population but just 13% of the overall U.S. population.

The death penalty remains a divisive issue among political partisans, with Democrats (49%) far less likely to be in favor of the punishment than Republicans (82%).
Majority Believe Death Penalty Applied Fairly
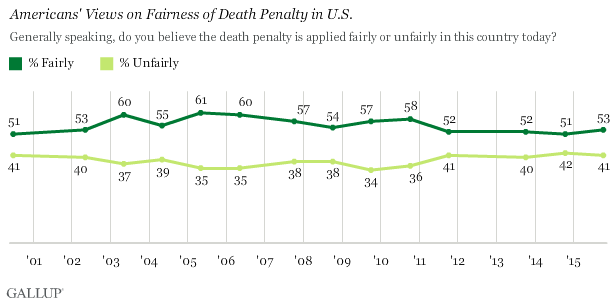
Fifty-three percent of Americans say that, generally speaking, the death penalty is applied fairly today in the U.S. While still a majority, this year's rate is below the high of 61% in 2005. Forty-one percent, meanwhile, say they believe the death penalty is applied unfairly.

Plurality of Americans Say Death Penalty Not Imposed Enough
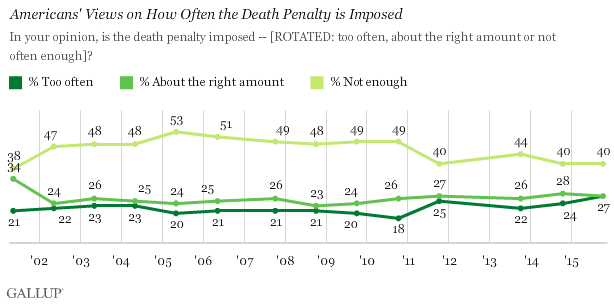
When asked about the frequency with which the death penalty is imposed, 40% of Americans say it is not imposed enough, with the remainder equally divided between saying it is imposed "too often" (27%) or "about the right amount" (27%). The proportion of Americans saying the death penalty is not imposed enough has fallen from a high of 53% in 2005, just as the number of executions has generally gone down over that time period.

Bottom Line
By many metrics -- the number of states that have banned the death penalty, the number of executions carried out or the actual population of inmates currently on death row -- the death penalty appears to be losing popularity in statehouses and courthouses across the country. But the public at large continues to support the use of the death penalty. A majority continue to assess the punishment as applied fairly, and a plurality wish it were applied more often.
But there is no denying that the death penalty is controversial -- reflected, at least somewhat, by the deep racial divide it causes. The cascade of exonerations for once-condemned inmates and the plethora of academic literature exploring the alleged disparities in the application of the punishment appear to have made juries less likely to issue a death penalty sentence and legislatures more likely to ban it.
Historical data are available in Gallup Analytics.
Survey Methods
Results for this Gallup poll are based on telephone interviews conducted Oct. 7-11, 2015, on the Gallup U.S. Daily survey, with a random sample of 1,015 adults, aged 18 and older, living in all 50 U.S. states and the District of Columbia. For results based on the total sample of national adults, the margin of sampling error is ±4 percentage points at the 95% confidence level. All reported margins of sampling error include computed design effects for weighting.
Each sample of national adults includes a minimum quota of 60% cellphone respondents and 40% landline respondents, with additional minimum quotas by time zone within region. Landline and cellular telephone numbers are selected using random-digit-dial methods.
View survey methodology, complete question responses and trends.
Learn more about how Gallup Poll Social Series works.
