Story Highlights
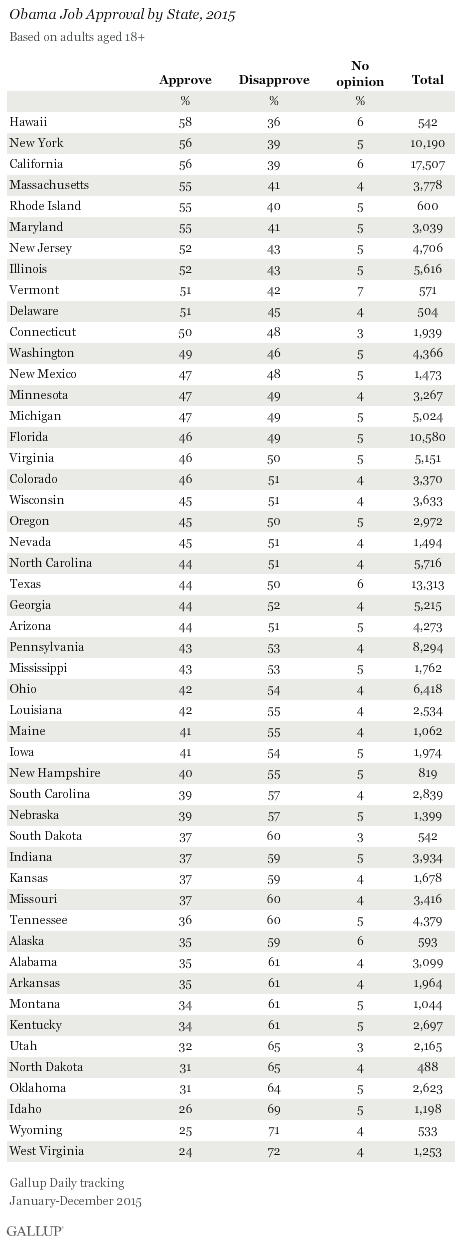
- Hawaii's 58% approval rating was Obama's best in 2015
- Less than a quarter rated him positively in West Virginia
- Majorities approved of Obama in 10 states, up from five in 2014
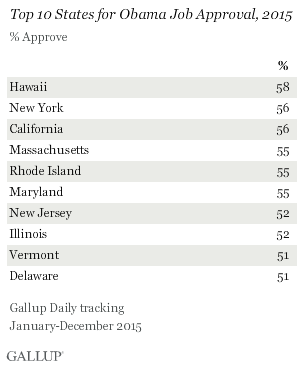
PRINCETON, N.J. -- President Barack Obama's average job approval rating in 2015 was 46%, up four percentage points from 2014. Accordingly, the number of majority-approving states doubled from five to 10 in that period. Hawaii led these states, with 58% approving of Obama's overall job performance, slightly ahead of 56% in New York and California. All but one of the seven other states in his top 10 were in the East; Obama's most recent home state of Illinois was the exception.
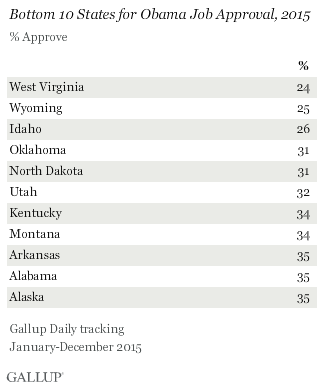
Obama's lowest average statewide approval rating in 2015 was in West Virginia (24%), but his ratings were nearly as low in Wyoming (25%) and Idaho (26%). The remainder of Obama's bottom 10 states gave him approval ratings ranging from 31% to 35%, more than 10 points below the national average.
These results are based on 177,990 Gallup Daily tracking interviews conducted nationally throughout 2015, including roughly 500 respondents in the least populous states and more than 1,000 in most other states. Gallup weighted each state's sample to match U.S. Census Bureau demographic parameters for that state's adult population. The full results by state appear at the end of this article.
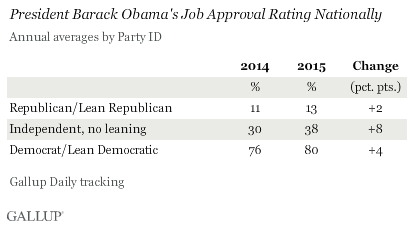
The improvement in Obama's nationwide approval rating, and the related expansion in the number of states where majorities approve of his job performance, might seem to contradict the decline in the number of "blue" states nationally in 2015. However, the slight improvement in Obama's approval rating among all party groups in 2015 largely explains this.
Approval of Obama increased by four points among Democrats and Democratic leaners and by two points among Republicans and Republican leaners, as well as by eight points among the relatively small group of Americans who identify as independents with no partisan leanings. Thus, while the percentage of Republicans rose in many states, the increase in Republicans' and other party groups' approval of Obama produced a more favorable national picture for him.
Coastal vs. Central Dichotomy in Obama Ratings Continues
The 50 states fall into five categories according to their average 2015 approval ratings:
- Well above average = approval rating of 55% or higher
- Above average = approval rating of 51% to 54%
- Average = approval rating within four percentage points of the 46% national average -- in other words, 42% to 50%
- Below average = approval rating of 38% to 41%
- Well below average = approval rating below 38%
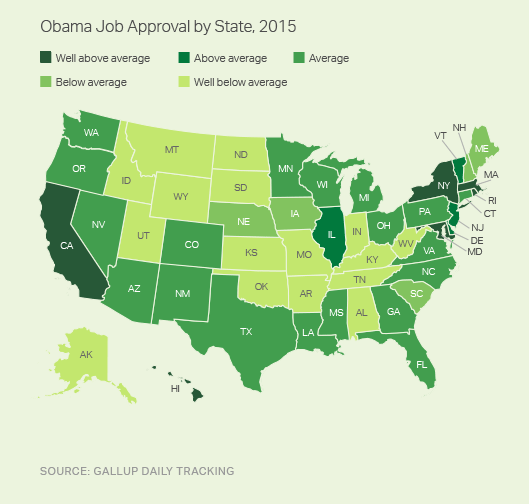
Obama's job approval rating increased at least slightly in nearly all 50 states in 2015, and as a result, the categorization of states with above- or below-average approval generally stayed the same as in 2014. Obama's strongest states remained clustered in the East, with the addition of California, Hawaii and Illinois, and his weakest states were located in the Rocky Mountain region, the Midwest and the South.
Bottom Line
A president's approval rating has considerable political significance in re-election years, as it indicates the incumbent's likelihood of re-election. In years when the president is not running for re-election, such as this one, the approval rating provides a broader indicator of his party's health, but generally needs to be reviewed in combination with other metrics, particularly party identification and party ratings.
This election year, knowledge of how well the president is perceived in each state may be useful in creating his campaign travel schedule, guiding him to those states -- particularly swing states -- where he is most popular and therefore may be most helpful to the Democratic nominee. The good news for that person, whomever he or she may be, is that at the start of 2016, Obama is bumping up against 50% approval, a significant improvement over his 2015 average. If this continues, it could mean there is less popular demand for change than when the presidential race started taking shape about a year ago.
Survey Methods
Results for this Gallup poll are based on telephone interviews conducted Jan. 2-Dec. 30, 2015, on the Gallup U.S. Daily tracking survey, with a random sample of 177,990 adults, aged 18 and older, living in all 50 U.S. states and the District of Columbia. For results based on the total sample of national adults, the margin of sampling error is ±1 percentage point at the 95% confidence level.
Margins of error for individual states are no greater than ±6 percentage points, and are ±3 percentage points in most states. All reported margins of sampling error include computed design effects for weighting.
Each sample of national adults includes a minimum quota of 60% cellphone respondents and 40% landline respondents, with additional minimum quotas by time zone within region. Landline and cellular telephone numbers are selected using random-digit-dial methods.
Learn more about how the Gallup U.S. Daily works.
