Story Highlights
- 48% of Americans approve of Obama's handling of foreign affairs
- Approval of his performance on the economy is steady, at 48%
- Americans most approving of work in education, race relations
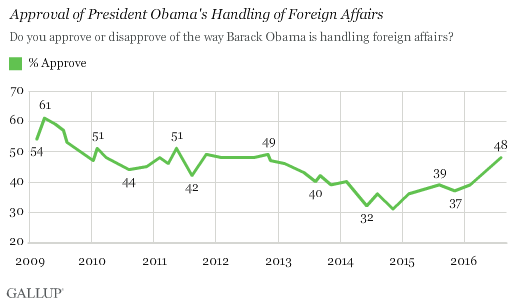
WASHINGTON, D.C. -- Nearly half of Americans (48%) approve of President Barack Obama's handling of foreign affairs in August, up markedly from 39% in February. The latest rating is the highest since November 2012 (49%), just days before Obama was re-elected.

With just five months left in Obama's presidency, Americans are as likely to approve (48%) as to disapprove (48%) of his performance on foreign affairs. Obama's second-term approval ratings on the issue have been fairly weak, averaging 39% as the administration has struggled to deal with a number of international challenges such as the rise of the Islamic State group, tense relations with Russia and the conflict in Syria. Obama averaged a higher 50% approval rating on foreign affairs during his first term. His second-term average on foreign affairs is among the lowest Gallup has measured for presidents since Ronald Reagan. Only George W. Bush had a lower rating on foreign affairs in a presidential term, at 38%.
Obama's latest foreign affairs rating was recorded in an Aug. 3-7 Gallup poll, after he rebuffed allegations that his administration paid Iran $400 million in cash in exchange for hostages. More recently, the Republican nominee for president alleged that Obama is the founder of the Islamic State.
Obama's Approval Rating on the Economy at Seven-Year High
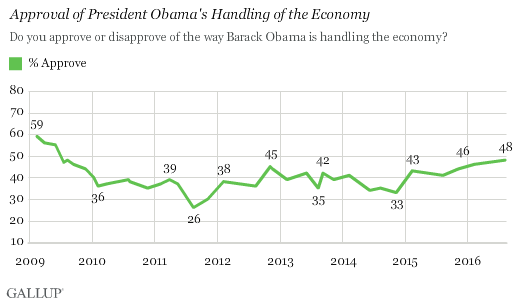
Americans' approval of Obama's handling of foreign affairs now matches his 48% approval on the economy, which has been steadily climbing over the past year. The recent low of 33% came just before the 2014 midterm elections that saw Obama's own party lose control of the Senate. But this figure has since steadily improved so that his rating is now at a seven-year high.

Obama's second-term average approval rating on the economy (40%) is about the same as his first-term average of 41% -- as well as the second-term average for President George W. Bush (41%).
These are historically low ratings, with George H.W. Bush (35%) being the only president to have scored a lower average on this issue over the past nine presidential terms.
Approval Up on President's Handling of Most Issues
Americans have been more approving of Obama's overall job performance than his handling of specific issues, as has been the case for most presidents since Reagan. Obama's overall approval rating of 52% in this August's poll is at least one percentage point higher than his rating for any of the seven issues Gallup asked about.
Of the seven issues included in the current poll, Obama rates best on education and race relations, both at 51%. However, Gallup has found withering hopefulness among Americans on the latter issue. His 48% ratings on the economy and foreign affairs are not far behind, while his approval on terrorism (45%) and immigration (44%) lag a bit further. He fares worst on gun policy, with 37% approval.
Since August 2015, Obama's approval ratings on most issues have improved, nearly matching the five-point increase in his overall job approval between the two polls.
Though Obama's approval rating on gun policy was not measured last year, his rating has not improved from two polls conducted in 2013, when he received 40% and 42% approval.
| August 2015 | August 2016 | ||||||||||||||||||||||||||||||||||||||||||||||||||||||||||||||||||||||||||||||||||||||||||||||||||
|---|---|---|---|---|---|---|---|---|---|---|---|---|---|---|---|---|---|---|---|---|---|---|---|---|---|---|---|---|---|---|---|---|---|---|---|---|---|---|---|---|---|---|---|---|---|---|---|---|---|---|---|---|---|---|---|---|---|---|---|---|---|---|---|---|---|---|---|---|---|---|---|---|---|---|---|---|---|---|---|---|---|---|---|---|---|---|---|---|---|---|---|---|---|---|---|---|---|---|---|
| % | % | ||||||||||||||||||||||||||||||||||||||||||||||||||||||||||||||||||||||||||||||||||||||||||||||||||
| Overall job approval | 47 | 52 | |||||||||||||||||||||||||||||||||||||||||||||||||||||||||||||||||||||||||||||||||||||||||||||||||
| Education | 44 | 51 | |||||||||||||||||||||||||||||||||||||||||||||||||||||||||||||||||||||||||||||||||||||||||||||||||
| Race relations | 46 | 51 | |||||||||||||||||||||||||||||||||||||||||||||||||||||||||||||||||||||||||||||||||||||||||||||||||
| Foreign affairs | 39 | 48 | |||||||||||||||||||||||||||||||||||||||||||||||||||||||||||||||||||||||||||||||||||||||||||||||||
| The economy | 41 | 48 | |||||||||||||||||||||||||||||||||||||||||||||||||||||||||||||||||||||||||||||||||||||||||||||||||
| Terrorism | 41 | 45 | |||||||||||||||||||||||||||||||||||||||||||||||||||||||||||||||||||||||||||||||||||||||||||||||||
| Immigration | 36 | 44 | |||||||||||||||||||||||||||||||||||||||||||||||||||||||||||||||||||||||||||||||||||||||||||||||||
| Gun policy | -- | 37 | |||||||||||||||||||||||||||||||||||||||||||||||||||||||||||||||||||||||||||||||||||||||||||||||||
| Gallup | |||||||||||||||||||||||||||||||||||||||||||||||||||||||||||||||||||||||||||||||||||||||||||||||||||
Bottom Line
As Obama's presidency nears its end and his overall job approval rating remains above the majority level, Americans' views of his handling of a variety of issues are improving as well. Americans' higher ratings of his performance on key issues reflect neither personal nor historical highs, but they do compare favorably with his ratings on these issues over the past seven-and-a-half years. His approval ratings on the economy and foreign affairs currently rank above the best since his first term.
His presidency is not yet over, however, and Obama's performance on these issues is a constant talking point for both presidential nominees -- one who seeks to tie her record to his, and another who ridicules Obama's performance on most issues. Regardless of who succeeds him, Obama's ratings as he departs from the White House will serve as a benchmark for the next president.
Historical data are available in Gallup Analytics.
Survey Methods
Results for this Gallup poll are based on telephone interviews conducted Aug. 3-7, 2016, with a random sample of 1,032 adults, aged 18 and older, living in all 50 U.S. states and the District of Columbia. For results based on the total sample of national adults, the margin of sampling error is ±4 percentage points at the 95% confidence level. All reported margins of sampling error include computed design effects for weighting.
Each sample of national adults includes a minimum quota of 60% cellphone respondents and 40% landline respondents, with additional minimum quotas by time zone within region. Landline and cellular telephone numbers are selected using random-digit-dial methods.
View complete question responses and trends.
Learn more about how the Gallup Poll Social Series works.


