Story Highlights
- Almost eight in 10 identify with a religion, mostly Christian
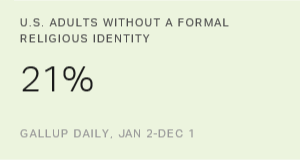
- 21% have no religious identity, up from 15% in 2008
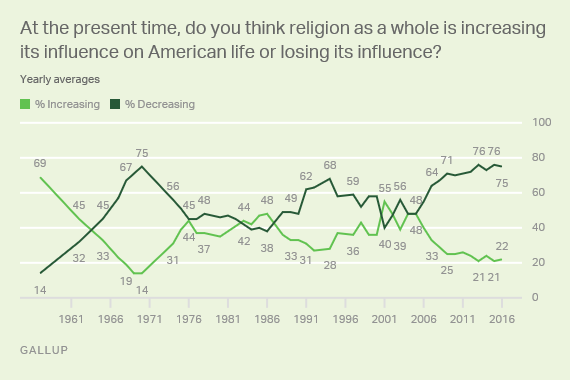
- Over seven in 10 say religion is losing its influence in U.S. society
PRINCETON, N.J. -- Religion remains an integral part of most Americans' lives, but Gallup's ongoing research shows how this has changed over time. The following are five important findings about religion in the U.S.:
1. America remains a largely Christian nation, although less so than in the past. Seventy-four percent of Americans identify with a Christian religion, and 5% identify with a non-Christian religion. The rest of the U.S. adult population, about 21%, either say they don't have a formal religious identity or don't give a response.
| % | |||||||||||||||||||||||||||||||||||||||||||||||||||||||||||||||||||||||||||||||||||||||||||||||||||
|---|---|---|---|---|---|---|---|---|---|---|---|---|---|---|---|---|---|---|---|---|---|---|---|---|---|---|---|---|---|---|---|---|---|---|---|---|---|---|---|---|---|---|---|---|---|---|---|---|---|---|---|---|---|---|---|---|---|---|---|---|---|---|---|---|---|---|---|---|---|---|---|---|---|---|---|---|---|---|---|---|---|---|---|---|---|---|---|---|---|---|---|---|---|---|---|---|---|---|---|
| Protestant/Other Christian | 48.9 | ||||||||||||||||||||||||||||||||||||||||||||||||||||||||||||||||||||||||||||||||||||||||||||||||||
| Catholic | 23.0 | ||||||||||||||||||||||||||||||||||||||||||||||||||||||||||||||||||||||||||||||||||||||||||||||||||
| Mormon | 1.8 | ||||||||||||||||||||||||||||||||||||||||||||||||||||||||||||||||||||||||||||||||||||||||||||||||||
| Jewish | 2.1 | ||||||||||||||||||||||||||||||||||||||||||||||||||||||||||||||||||||||||||||||||||||||||||||||||||
| Muslim | 0.8 | ||||||||||||||||||||||||||||||||||||||||||||||||||||||||||||||||||||||||||||||||||||||||||||||||||
| Other non-Christian religion | 2.5 | ||||||||||||||||||||||||||||||||||||||||||||||||||||||||||||||||||||||||||||||||||||||||||||||||||
| None/Atheist/Agnostic | 18.2 | ||||||||||||||||||||||||||||||||||||||||||||||||||||||||||||||||||||||||||||||||||||||||||||||||||
| No response given | 2.6 | ||||||||||||||||||||||||||||||||||||||||||||||||||||||||||||||||||||||||||||||||||||||||||||||||||
| Based on 173,229 interviews conducted Jan. 2-Dec. 19, 2016 | |||||||||||||||||||||||||||||||||||||||||||||||||||||||||||||||||||||||||||||||||||||||||||||||||||
| Gallup | |||||||||||||||||||||||||||||||||||||||||||||||||||||||||||||||||||||||||||||||||||||||||||||||||||
The dominance of Christianity in the U.S. is not new, but it has changed over time. The U.S. has seen an increase in those with no formal religious identity (sometimes called "nones") and a related decrease in those identifying with a Christian religion. Since 2008, when Gallup began tracking religion on its daily survey, the "nones" have increased by six percentage points, while those identifying as Christian have decreased by six points. The 5% who identify with a non-Christian religion has stayed constant.
In the late 1940s and 1950s, when Gallup began regularly measuring religious identity, over nine in 10 American adults identified as Christian -- either Protestant or Catholic -- with most of the rest saying they were Jewish.
2. The trend away from formal religion continues. The most significant trend in Americans' religiosity in recent decades has been the growing shift away from formal or official religion. About one in five U.S. adults (21%) don't have a formal religious identity. This represents a major change from the late 1940s and 1950s when only 2% to 3% of Americans did not report a formal religious identity when asked about it in Gallup surveys. The increase in those claiming no religious identity began in the 1970s, with the percentage crossing the 10% threshold in 1990 and climbing into the teens in the 2000s.
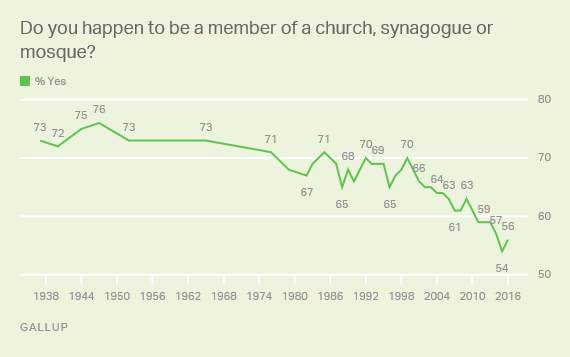
Americans are also significantly less likely now than they were in the past to claim membership in a church, synagogue or mosque. In 1937, when Gallup first asked about church membership, 73% said they were a member of a church. This figure dropped into the upper 60% range in the 1980s and continued to decrease from that point on. It fell to its lowest point of 54% in 2015 but increased slightly to 56% this year.
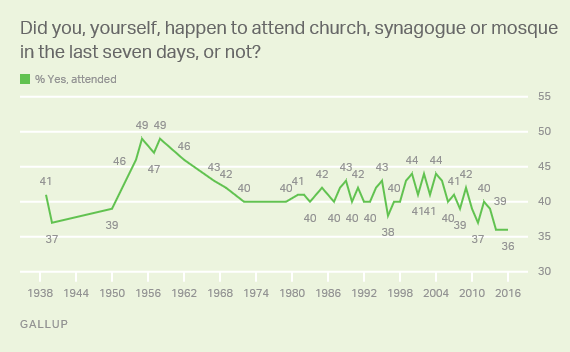
Self-reported church attendance is also lower than it has been in past decades -- although perhaps not as low as might be expected, given the drop in church membership and the increase in the percentage of those with no religious identity.
Gallup's longest-running religious service attendance question asks, "Did you, yourself, happen to attend church, synagogue or mosque in the last seven days, or not?" In 1939, when Gallup first asked this question, 41% said "yes." That percentage dropped to 37% in 1940 and rose to 39% in 1950. It continued to climb, reaching as high as 49% at multiple points in the 1950s. Attendance then settled down to figures around 40% for decades, before dropping to 36% for the past three years.
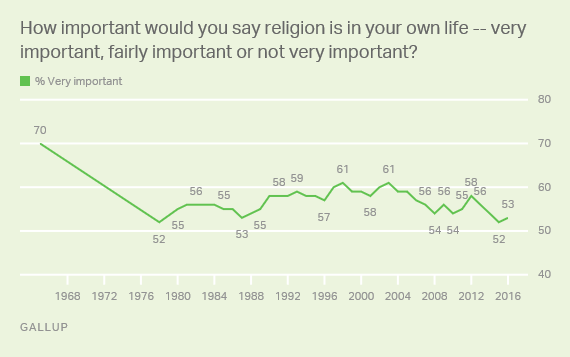
3. A majority still say religion is important in their lives. A majority of Americans (53%) say that religion is "very important" in their lives. This is down marginally from recent years, but the trend over time has shown less of a decline than have other religious indicators such as religious identification or church membership. In 1965, 70% said that religion was "very important" in their lives, but figures have since ranged from 52% to 61%. The percentage reporting that religion is "very important" hit the low end of this range in the 1980s and has done so again in more recent years. The 53% who say religion is "very important" this year is low on a relative basis but is similar to what Gallup measured in 1978 and 1987.
A different question included on Gallup Daily tracking since 2008 offers two choices, asking if religion is "important in your daily life" or not. Sixty-four percent of those interviewed in 2016 say that religion is important, down two points since 2008.
4. Americans continue to say that religion is losing its influence in American society. Americans continue to perceive that religion is less influential than it used to be, with 72% in 2016 say that religion is losing its influence on American life.
The perception that religion is losing influence in the U.S. has been fairly constant over the past eight years or so. Before that, the figure fluctuated over time. For example, in 1957 and shortly after the 9/11 terrorist attacks, a majority of Americans said that religion was increasing its influence on American life. During the Reagan administration, the percentages saying that religion was increasing in influence and those saying it was decreasing in influence were roughly equal.
Before 2009, there were only two times in Gallup's history when more than seven in 10 Americans thought religion was losing its influence: in 1969 and 1970.
5. Religion remains intertwined with political self-identification. Religiosity continued in 2016 to significantly correlate with partisan identification. Slightly more than half of Republicans this year are "highly religious," based on a combination of their self-reported religious service attendance and the importance of religion in their daily life. That compares with a third of independents and Democrats who say the same. By contrast, 20% of Republicans are not religious, compared with 37% of the two other political groups.
| Republicans | Independents | Democrats | |||||||||||||||||||||||||||||||||||||||||||||||||||||||||||||||||||||||||||||||||||||||||||||||||
|---|---|---|---|---|---|---|---|---|---|---|---|---|---|---|---|---|---|---|---|---|---|---|---|---|---|---|---|---|---|---|---|---|---|---|---|---|---|---|---|---|---|---|---|---|---|---|---|---|---|---|---|---|---|---|---|---|---|---|---|---|---|---|---|---|---|---|---|---|---|---|---|---|---|---|---|---|---|---|---|---|---|---|---|---|---|---|---|---|---|---|---|---|---|---|---|---|---|---|---|
| % | % | % | |||||||||||||||||||||||||||||||||||||||||||||||||||||||||||||||||||||||||||||||||||||||||||||||||
| Highly religious | 51 | 33 | 33 | ||||||||||||||||||||||||||||||||||||||||||||||||||||||||||||||||||||||||||||||||||||||||||||||||
| Moderately religious | 29 | 30 | 30 | ||||||||||||||||||||||||||||||||||||||||||||||||||||||||||||||||||||||||||||||||||||||||||||||||
| Not religious | 20 | 37 | 37 | ||||||||||||||||||||||||||||||||||||||||||||||||||||||||||||||||||||||||||||||||||||||||||||||||
| Based on 173,229 interviews conducted Jan. 2-Dec. 19, 2016 | |||||||||||||||||||||||||||||||||||||||||||||||||||||||||||||||||||||||||||||||||||||||||||||||||||
| Gallup | |||||||||||||||||||||||||||||||||||||||||||||||||||||||||||||||||||||||||||||||||||||||||||||||||||
Gallup began tracking religiosity on a continual basis in 2008, and although overall religiosity is down across all political groups since then, it remains much higher among Republicans than among the other two political groups.
The connection between religion and politics manifested itself in the presidential election this fall. Exit poll data showed that among those who reported attending religious services weekly, 55% voted for Donald Trump and 41% voted for Hillary Clinton. Among those who never attend religious services, 62% voted for Clinton and 30% voted for Trump.
Bottom Line
Gallup data in 2016 show a leveling off in downward trends in church attendance, the importance of religion and the perception that religion is losing influence in society. This may be a short-term phenomenon or an indication of a more lasting pattern. Demographics in a broad sense could predict an uptick in religiosity if the same historical patterns continue to hold. Large numbers of baby boomers and millennials are entering the age ranges in which religiosity has traditionally been higher. But these patterns may change, and it will take years of data collection to determine if formal religiosity will continue to decrease or level off.
