Story Highlights
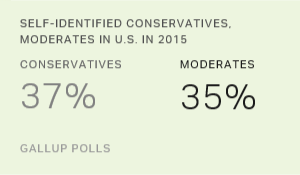
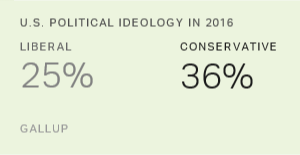
- 36% of Americans now conservative, 25% liberal
- Liberal figure has inched up from 17% in 1990s
- Conservatives mainly steady, while moderates decline
PRINCETON, N.J. -- Many more Americans have considered themselves politically conservative than liberal since the early 1990s. That remained the case in 2016, when an average of 36% of U.S. adults throughout the year identified themselves as conservative and 25% as liberal. Yet that 11-percentage-point margin is half of what it was at its peak in 1996 and is down from 14 points only two years ago.
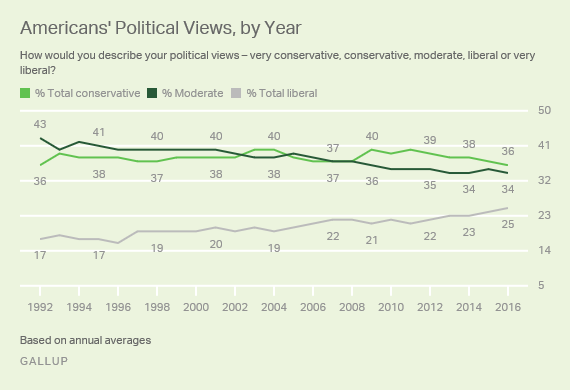
Since Gallup began routinely measuring Americans' political ideology in 1992, conservative identification has varied between 36% and 40%. At the same time, there has been a clear increase in the percentage identifying as politically liberal, from 17% to 25%. This has been accompanied by a corresponding decrease in the percentage identifying as "moderate," from 43% to 34%.
Moderates were consistently the most prevalent group from 1992 to 2002, before first yielding that designation to conservatives in 2003. Within the long-term stability of conservatism, the percentage of Americans self-identifying as conservative jumped to 40% several times between 2003 and 2011, but it has since returned to 36%.
The annual ideology figures are based on combined data from Gallup's multiday, non-tracking surveys conducted each year, encompassing no fewer than 11,000 interviews, and in most years, more than 20,000 interviews.
Democrats Shifting Further Left; GOP Remains Conservative
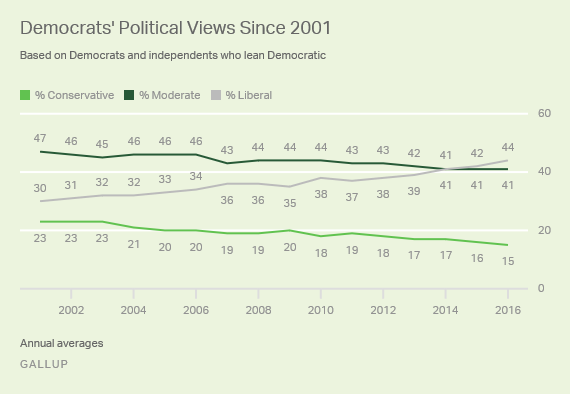
Most of the long-term change in Americans' political views occurred after 2000 and can be explained by one overarching factor -- an increasing likelihood of Democrats (including independents who lean Democratic) to self-identify as liberal. Democratic liberal identification has increased by about one percentage point each year, from 30% in 2001 to 44% in 2016. As a result, liberalism now ranks as the top ideological group among Democrats.
Meanwhile, there has been an eight-point decline since 2001 in the percentage of Democrats identifying as conservative and a six-point decline in the percentage of Democrats who are moderate.
Among Democrats, all major demographic and regional subgroups have warmed to the liberal label since 2001. However, the most movement has been among older Democrats and non-Hispanic whites.
Whereas in 2001, the youngest Democrats -- those younger than 30 -- were far more likely than older Democrats to call themselves liberal, the age groups are fairly similar today. Between 40% and 49% of Democrats of all ages now call themselves liberal.
On the other hand, the sharp increase in liberals among white Democrats, from 32% in 2001 to 50% in 2016 -- has created more ideological separation between white and nonwhite Democrats. Over the same period, the percentage of nonwhites identifying as liberal increased only nine percentage points, from 27% to 36%.
| 2001 | 2016 | Change | |||||||||||||||||||||||||||||||||||||||||||||||||||||||||||||||||||||||||||||||||||||||||||||||||
|---|---|---|---|---|---|---|---|---|---|---|---|---|---|---|---|---|---|---|---|---|---|---|---|---|---|---|---|---|---|---|---|---|---|---|---|---|---|---|---|---|---|---|---|---|---|---|---|---|---|---|---|---|---|---|---|---|---|---|---|---|---|---|---|---|---|---|---|---|---|---|---|---|---|---|---|---|---|---|---|---|---|---|---|---|---|---|---|---|---|---|---|---|---|---|---|---|---|---|---|
| % | % | (pct. pts.) | |||||||||||||||||||||||||||||||||||||||||||||||||||||||||||||||||||||||||||||||||||||||||||||||||
| Total Democrats | 30 | 44 | +14 | ||||||||||||||||||||||||||||||||||||||||||||||||||||||||||||||||||||||||||||||||||||||||||||||||
| Men | 30 | 42 | +12 | ||||||||||||||||||||||||||||||||||||||||||||||||||||||||||||||||||||||||||||||||||||||||||||||||
| Women | 30 | 45 | +15 | ||||||||||||||||||||||||||||||||||||||||||||||||||||||||||||||||||||||||||||||||||||||||||||||||
| East | 31 | 47 | +16 | ||||||||||||||||||||||||||||||||||||||||||||||||||||||||||||||||||||||||||||||||||||||||||||||||
| Midwest | 28 | 44 | +16 | ||||||||||||||||||||||||||||||||||||||||||||||||||||||||||||||||||||||||||||||||||||||||||||||||
| South | 27 | 37 | +10 | ||||||||||||||||||||||||||||||||||||||||||||||||||||||||||||||||||||||||||||||||||||||||||||||||
| West | 37 | 51 | +14 | ||||||||||||||||||||||||||||||||||||||||||||||||||||||||||||||||||||||||||||||||||||||||||||||||
| High school or less | 23 | 34 | +11 | ||||||||||||||||||||||||||||||||||||||||||||||||||||||||||||||||||||||||||||||||||||||||||||||||
| Some college | 31 | 43 | +12 | ||||||||||||||||||||||||||||||||||||||||||||||||||||||||||||||||||||||||||||||||||||||||||||||||
| College graduate only | 37 | 53 | +16 | ||||||||||||||||||||||||||||||||||||||||||||||||||||||||||||||||||||||||||||||||||||||||||||||||
| Postgraduate | 45 | 59 | +14 | ||||||||||||||||||||||||||||||||||||||||||||||||||||||||||||||||||||||||||||||||||||||||||||||||
| 18 to 29 | 40 | 49 | +9 | ||||||||||||||||||||||||||||||||||||||||||||||||||||||||||||||||||||||||||||||||||||||||||||||||
| 30 to 49 | 30 | 44 | +14 | ||||||||||||||||||||||||||||||||||||||||||||||||||||||||||||||||||||||||||||||||||||||||||||||||
| 50 to 64 | 28 | 40 | +12 | ||||||||||||||||||||||||||||||||||||||||||||||||||||||||||||||||||||||||||||||||||||||||||||||||
| 65+ | 23 | 42 | +19 | ||||||||||||||||||||||||||||||||||||||||||||||||||||||||||||||||||||||||||||||||||||||||||||||||
| Non-Hispanic white | 32 | 50 | +18 | ||||||||||||||||||||||||||||||||||||||||||||||||||||||||||||||||||||||||||||||||||||||||||||||||
| Total Hispanic and nonwhite | 27 | 36 | +9 | ||||||||||||||||||||||||||||||||||||||||||||||||||||||||||||||||||||||||||||||||||||||||||||||||
| Gallup | |||||||||||||||||||||||||||||||||||||||||||||||||||||||||||||||||||||||||||||||||||||||||||||||||||
Republicans Maintain Strong Conservative Orientation
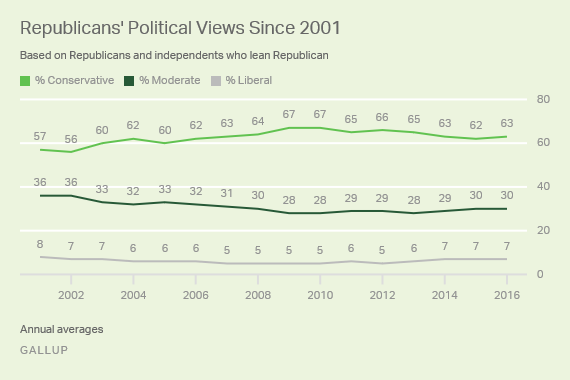
In contrast to the leftward shift in how Democrats describe their views, Republicans (including independents who lean Republican) have maintained a strong tendency to identify as conservative. However, the extent of this has varied slightly. At 63%, the percentage conservative today is higher than in 2001, but below the peak of 67% in 2009 and 2010.
Thirty percent of Republicans identify as political moderates, while fewer than one in 10 say they are political liberals.
Bottom Line
More Americans continue to label themselves as conservative than as moderate or liberal. However, the liberal percentage has been growing, mainly at the expense of moderates. The Democratic focus of this change represents a hardening of political polarization between the two major parties. With most Republicans already identifying as conservative and more Democrats identifying as liberal, the parties are moving further apart ideologically.
The most obvious implication of this after the 2016 election is that the parties may increasingly nominate candidates who are wholly unacceptable to the opposing party. Additionally, it may be affecting the ideological bent of Americans' representatives in Congress and the pressure these leaders face from their constituents to adhere to conservative versus liberal orthodoxy.
On the other hand, if the term "liberal" is simply growing in public acceptance, the shift could be more a matter of semantics than a paradigm change. People who once opted for the word "moderate" may be more willing to call themselves "liberal" even if their views on the issues are the same. However, with major changes over the past two decades in Americans' acceptance of gay marriage, support for legalized marijuana and growing opposition to the death penalty, at least some of the shift in labeling appears to be rooted in changing perspectives.
Historical data are available in Gallup Analytics.
Survey Methods
Results are based on aggregated telephone interviews from 17 separate Gallup polls conducted in 2016, with a random sample of 17,055 adults, aged 18 and older, living in all 50 U.S. states and the District of Columbia.
For results based on the total sample of national adults, the margin of sampling error is ±1 percentage point at the 95% confidence level. All reported margins of sampling error include computed design effects for weighting.
Each sample of national adults includes a minimum quota of 60% cellphone respondents and 40% landline respondents, with additional minimum quotas by time zone within region. Landline and cellular telephone numbers are selected using random-digit-dial methods.
Learn more about how the Gallup Poll Social Series works.