Story Highlights
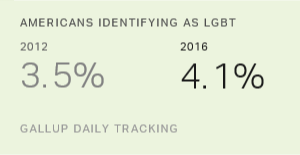
- 10 million American adults identify as LGBT (4.1%)
- LGBT millennials up from 5.8% in 2012 to 7.3% in 2016
- LGBT identification higher among women
WASHINGTON, D.C. -- The portion of American adults identifying as lesbian, gay, bisexual or transgender (LGBT) increased to 4.1% in 2016 from 3.5% in 2012. These figures, drawn from the largest representative sample of LGBT Americans collected in the U.S., imply that more than an estimated 10 million adults now identify as LGBT in the U.S. today, approximately 1.75 million more compared with 2012.
| 2012 | 2013 | 2014 | 2015 | 2016 | |||||||||||||||||||||||||||||||||||||||||||||||||||||||||||||||||||||||||||||||||||||||||||||||
|---|---|---|---|---|---|---|---|---|---|---|---|---|---|---|---|---|---|---|---|---|---|---|---|---|---|---|---|---|---|---|---|---|---|---|---|---|---|---|---|---|---|---|---|---|---|---|---|---|---|---|---|---|---|---|---|---|---|---|---|---|---|---|---|---|---|---|---|---|---|---|---|---|---|---|---|---|---|---|---|---|---|---|---|---|---|---|---|---|---|---|---|---|---|---|---|---|---|---|---|
| % | % | % | % | % | |||||||||||||||||||||||||||||||||||||||||||||||||||||||||||||||||||||||||||||||||||||||||||||||
| % LGBT | 3.5 | 3.6 | 3.7 | 3.9 | 4.1 | ||||||||||||||||||||||||||||||||||||||||||||||||||||||||||||||||||||||||||||||||||||||||||||||
| Estimated number of LGBT | 8.3 million | 8.673 million | 9.18 million | 9.652 million | 10.052 million | ||||||||||||||||||||||||||||||||||||||||||||||||||||||||||||||||||||||||||||||||||||||||||||||
| Gallup Daily Tracking | |||||||||||||||||||||||||||||||||||||||||||||||||||||||||||||||||||||||||||||||||||||||||||||||||||
This analysis is based on interviews with a random sample of more than 1.6 million U.S. adults as part of Gallup Daily tracking. Across the five years of data collection, more than 49,000 respondents said "yes" when asked, "Do you, personally, identify as lesbian, gay, bisexual or transgender?"
Millennials, defined here as those born between 1980 and 1998, drive virtually all of the increases observed in overall LGBT self-identification. The portion of that generation identifying as LGBT increased from 5.8% in 2012 to 7.3% in 2016. LGBT identification remained relatively stable over the five-year period at 3.2% among Generation X and declined slightly from 2.7% to 2.4% among baby boomers and from 1.8% to 1.4% among traditionalists.
| 2012 | 2013 | 2014 | 2015 | 2016 | |||||||||||||||||||||||||||||||||||||||||||||||||||||||||||||||||||||||||||||||||||||||||||||||
|---|---|---|---|---|---|---|---|---|---|---|---|---|---|---|---|---|---|---|---|---|---|---|---|---|---|---|---|---|---|---|---|---|---|---|---|---|---|---|---|---|---|---|---|---|---|---|---|---|---|---|---|---|---|---|---|---|---|---|---|---|---|---|---|---|---|---|---|---|---|---|---|---|---|---|---|---|---|---|---|---|---|---|---|---|---|---|---|---|---|---|---|---|---|---|---|---|---|---|---|
| % | % | % | % | % | |||||||||||||||||||||||||||||||||||||||||||||||||||||||||||||||||||||||||||||||||||||||||||||||
| Millennials (1980-1998) | 5.8 | 6.0 | 6.3 | 6.7 | 7.3 | ||||||||||||||||||||||||||||||||||||||||||||||||||||||||||||||||||||||||||||||||||||||||||||||
| Generation X (1965-1979) | 3.2 | 3.3 | 3.4 | 3.3 | 3.2 | ||||||||||||||||||||||||||||||||||||||||||||||||||||||||||||||||||||||||||||||||||||||||||||||
| Baby boomers (1946-1964) | 2.7 | 2.7 | 2.7 | 2.6 | 2.4 | ||||||||||||||||||||||||||||||||||||||||||||||||||||||||||||||||||||||||||||||||||||||||||||||
| Traditionalists (1913-1945) | 1.8 | 1.8 | 1.9 | 1.5 | 1.4 | ||||||||||||||||||||||||||||||||||||||||||||||||||||||||||||||||||||||||||||||||||||||||||||||
| Gallup Daily Tracking | |||||||||||||||||||||||||||||||||||||||||||||||||||||||||||||||||||||||||||||||||||||||||||||||||||
Millennials are more than twice as likely as any other generation to identify as LGBT. In 2012, they accounted for 43% of LGBT-identified adults. As a result of their disproportionate increases in identification since then, they now account for 58%. Millennials comprise 32% of the general adult population.
Increases in LGBT Identification Sharper Among Women, Asians and Hispanics
LGBT identification increases are more pronounced in women than in men. In 2012, 3.5% of women identified as LGBT, comparable to the 3.4% of men. By 2016, LGBT identification in women increased to 4.4% compared with 3.7% among men. These changes mean that the portion of women among LGBT-identified adults rose slightly from 52% to 55%.
| 2012 | 2013 | 2014 | 2015 | 2016 | |||||||||||||||||||||||||||||||||||||||||||||||||||||||||||||||||||||||||||||||||||||||||||||||
|---|---|---|---|---|---|---|---|---|---|---|---|---|---|---|---|---|---|---|---|---|---|---|---|---|---|---|---|---|---|---|---|---|---|---|---|---|---|---|---|---|---|---|---|---|---|---|---|---|---|---|---|---|---|---|---|---|---|---|---|---|---|---|---|---|---|---|---|---|---|---|---|---|---|---|---|---|---|---|---|---|---|---|---|---|---|---|---|---|---|---|---|---|---|---|---|---|---|---|---|
| % | % | % | % | % | |||||||||||||||||||||||||||||||||||||||||||||||||||||||||||||||||||||||||||||||||||||||||||||||
| Male | 3.4 | 3.5 | 3.6 | 3.7 | 3.7 | ||||||||||||||||||||||||||||||||||||||||||||||||||||||||||||||||||||||||||||||||||||||||||||||
| Female | 3.5 | 3.6 | 3.9 | 4.1 | 4.4 | ||||||||||||||||||||||||||||||||||||||||||||||||||||||||||||||||||||||||||||||||||||||||||||||
| White, non-Hispanic | 3.2 | 3.3 | 3.4 | 3.5 | 3.6 | ||||||||||||||||||||||||||||||||||||||||||||||||||||||||||||||||||||||||||||||||||||||||||||||
| Black, non-Hispanic | 4.4 | 4.0 | 4.6 | 4.5 | 4.6 | ||||||||||||||||||||||||||||||||||||||||||||||||||||||||||||||||||||||||||||||||||||||||||||||
| Hispanic | 4.3 | 4.7 | 4.9 | 5.1 | 5.4 | ||||||||||||||||||||||||||||||||||||||||||||||||||||||||||||||||||||||||||||||||||||||||||||||
| Asian, non-Hispanic | 3.5 | 3.3 | 4.2 | 4.9 | 4.9 | ||||||||||||||||||||||||||||||||||||||||||||||||||||||||||||||||||||||||||||||||||||||||||||||
| Other, non-Hispanic | 6.0 | 5.6 | 6.0 | 5.6 | 6.3 | ||||||||||||||||||||||||||||||||||||||||||||||||||||||||||||||||||||||||||||||||||||||||||||||
| Gallup Daily Tracking | |||||||||||||||||||||||||||||||||||||||||||||||||||||||||||||||||||||||||||||||||||||||||||||||||||
Among racial and ethnic minorities, the largest increases since 2012 in LGBT identification occurred among Asians (3.5% to 4.9%) and Hispanics (4.3% to 5.4%). Among whites, the comparable figures are 3.2% to 3.6%. Black Americans showed only a slight increase from 4.4% to 4.6%, and among "other" racial and ethnic groups, the increase was from 6.0% to 6.3%.
The relatively larger increases in LGBT identification among racial and ethnic groups other than white, non-Hispanics mean that these racial and ethnic minorities now account for 40% of LGBT-identified adults compared with 33% in 2012. In the general population, 33% of adults identify their race or ethnicity as other than white, non-Hispanic, an increase from 28% in 2012.
The variations in increases in LGBT identification by race and ethnicity are likely affected by differences in the age composition of the groups. According to the Gallup data, the average age of Asian adults in the U.S. is 35, the youngest among the race/ethnicity groupings. Average age is 39 among Hispanics, 44 among blacks, 51 among white adults, and 44 among "other" racial and ethnic groups. Given the big changes in LGBT identification among millennials, the youngest generation, it's not surprising that younger racial and ethnic groups report larger LGBT identification increases.
LGBT Identification Increased Among All Income and Education Groups
While the portion of LGBT individuals decreases with income, all income groups saw similar increases in the proportion of adults identifying as LGBT.
| 2012 | 2013 | 2014 | 2015 | 2016 | |||||||||||||||||||||||||||||||||||||||||||||||||||||||||||||||||||||||||||||||||||||||||||||||
|---|---|---|---|---|---|---|---|---|---|---|---|---|---|---|---|---|---|---|---|---|---|---|---|---|---|---|---|---|---|---|---|---|---|---|---|---|---|---|---|---|---|---|---|---|---|---|---|---|---|---|---|---|---|---|---|---|---|---|---|---|---|---|---|---|---|---|---|---|---|---|---|---|---|---|---|---|---|---|---|---|---|---|---|---|---|---|---|---|---|---|---|---|---|---|---|---|---|---|---|
| % | % | % | % | % | |||||||||||||||||||||||||||||||||||||||||||||||||||||||||||||||||||||||||||||||||||||||||||||||
| Less than $36,000 | 4.7 | 4.5 | 4.9 | 5.1 | 5.5 | ||||||||||||||||||||||||||||||||||||||||||||||||||||||||||||||||||||||||||||||||||||||||||||||
| $36,000 to <$90,000 | 3.1 | 3.4 | 3.5 | 3.9 | 4.0 | ||||||||||||||||||||||||||||||||||||||||||||||||||||||||||||||||||||||||||||||||||||||||||||||
| $90,000 or more | 3.0 | 3.5 | 3.6 | 3.6 | 3.7 | ||||||||||||||||||||||||||||||||||||||||||||||||||||||||||||||||||||||||||||||||||||||||||||||
| High school or less | 3.5 | 3.5 | 3.9 | 4.1 | 4.1 | ||||||||||||||||||||||||||||||||||||||||||||||||||||||||||||||||||||||||||||||||||||||||||||||
| Some college | 3.8 | 3.9 | 3.9 | 3.9 | 4.1 | ||||||||||||||||||||||||||||||||||||||||||||||||||||||||||||||||||||||||||||||||||||||||||||||
| College graduate | 2.9 | 3.3 | 3.5 | 3.6 | 4.1 | ||||||||||||||||||||||||||||||||||||||||||||||||||||||||||||||||||||||||||||||||||||||||||||||
| Postgraduate | 3.3 | 3.6 | 3.7 | 3.9 | 3.9 | ||||||||||||||||||||||||||||||||||||||||||||||||||||||||||||||||||||||||||||||||||||||||||||||
| Gallup Daily Tracking | |||||||||||||||||||||||||||||||||||||||||||||||||||||||||||||||||||||||||||||||||||||||||||||||||||
In 2012, the portion of LGBT adults varied by educational attainment, ranging from 2.9% among college graduates to 3.8% among those who had some college education. By 2016, there was virtually no variation by education, with 3.9% of those with a postgraduate degree identifying as LGBT along with 4.1% of all other educational groups.
Increases in LGBT Identification Largely Among Those Who Are Not Religious
The proportion of highly or moderately religious adults who identified as LGBT remained virtually the same between 2012 and 2016, but increased from 5.3% to 7.0% among those who are not religious. As a result, nonreligious adults are now more than three times more likely to identify as LGBT than those who are highly religious.
| 2012 | 2013 | 2014 | 2015 | 2016 | |||||||||||||||||||||||||||||||||||||||||||||||||||||||||||||||||||||||||||||||||||||||||||||||
|---|---|---|---|---|---|---|---|---|---|---|---|---|---|---|---|---|---|---|---|---|---|---|---|---|---|---|---|---|---|---|---|---|---|---|---|---|---|---|---|---|---|---|---|---|---|---|---|---|---|---|---|---|---|---|---|---|---|---|---|---|---|---|---|---|---|---|---|---|---|---|---|---|---|---|---|---|---|---|---|---|---|---|---|---|---|---|---|---|---|---|---|---|---|---|---|---|---|---|---|
| % | % | % | % | % | |||||||||||||||||||||||||||||||||||||||||||||||||||||||||||||||||||||||||||||||||||||||||||||||
| Highly religious | 2.0 | 2.1 | 2.2 | 2.1 | 1.9 | ||||||||||||||||||||||||||||||||||||||||||||||||||||||||||||||||||||||||||||||||||||||||||||||
| Moderately religious | 3.6 | 3.5 | 3.5 | 3.7 | 3.5 | ||||||||||||||||||||||||||||||||||||||||||||||||||||||||||||||||||||||||||||||||||||||||||||||
| Not religious | 5.3 | 5.5 | 5.7 | 6.2 | 7.0 | ||||||||||||||||||||||||||||||||||||||||||||||||||||||||||||||||||||||||||||||||||||||||||||||
| Gallup Daily Tracking | |||||||||||||||||||||||||||||||||||||||||||||||||||||||||||||||||||||||||||||||||||||||||||||||||||
Today, substantially more than half (56%) of LGBT-identified adults are not religious compared with 32% of the general population of adults.
Bottom Line
Self-identification as LGBT represents only one aspect of measuring sexual orientation and gender identity. For example, research shows that direct assessments of same-sex sexual behavior or attraction yield very different (and often larger) population estimates when compared with estimates of LGBT self-identification. A variety of factors can affect the willingness of adults to identify as LGBT. These can include how comfortable and confident survey respondents feel about the confidentiality and privacy of data collected.
Gallup research shows that data security and confidentiality are not major concerns of millennials. This could be one factor that explains why they are so much more likely to identify as LGBT when compared with other generations. They are more comfortable than their older counterparts with the idea of sharing what some might consider private information on surveys.
Perhaps an even larger factor concerns the differences in social climate that existed when individuals were teenagers and young adults. This is when many LGBT people begin the process of coming out and sharing their sexual orientation and gender identity with others.
Since 1977, Gallup has asked Americans if they think that gay and lesbian relationships between consenting adults should be legal. In July 1986, just 32% supported legalization of same-sex relationships, marking a low point in that support in Gallup polling. By 1999, when the first millennials were becoming adults, half of Americans supported legalization and, as of May 2016, the figure had risen to 68%.
Data from the General Social Survey (GSS), a biannual survey of adults in the U.S. conducted by NORC at the University of Chicago, show a similar pattern. Throughout the 1970s and 1980s, large majorities of Americans said that same-sex sexual relationships were always wrong. Beginning in the 1990s, attitudes made a clear shift toward greater acceptance of same-sex relationships. By 2000, 59% of Americans thought they were always wrong, and the 2014 survey marked the first year that more respondents (49%) thought that same-sex relationships were never wrong than thought they were always wrong (40%).
It's likely that millennials are the first generation in the U.S. to grow up in an environment where social acceptance of the LGBT community markedly increased. This may be an important factor in explaining their greater willingness to identify as LGBT. They may not have experienced the levels of discrimination and stigma experienced by their older counterparts. The perceived risks associated with publicly identifying as LGBT might also be lower in millennials than among other generations.
In a span of only five years, the demographic composition of Americans who identify as LGBT has markedly changed. It has become larger, younger, more female and less religious. These demographic traits are of interest to a wide range of constituencies.
For example, the National Institutes of Health recently designated sexual and gender minorities as a health disparity population for NIH research. Understanding the underlying demographics of a population is critical to assessing health and well-being. Corporate America also increasingly views the LGBT community as a market for consumer products and services and actively courts its support. Responses to the controversial passage of HB2 in North Carolina, a law that requires citizens to use the public facility that corresponds with their "biological" gender and limits the passage of LGBT anti-discrimination laws in the state, provide an example of corporate support for LGBT issues. Many large companies and organizations called for a repeal and implemented what amounted to economic sanctions in the state that estimates say amount to at least $630 million in lost business. As companies reach out to LGBT consumers, demographics are critical to understanding how best to reach them.
Relatively rapid shifts in the composition of the LGBT-identified community enhance the need for data collection that measures sexual orientation and gender identity. Data collected only a few years ago may not accurately reflect key characteristics of the current LGBT population.
Survey Methods
These results are based on telephone interviews with a random sample of 1,626,773 U.S. adults, aged 18 and older, living in all 50 states and the District of Columbia, collected from June 1, 2012, through Dec. 30, 2016, as part of the Gallup Daily tracking survey and the Gallup-Healthways Well-Being Index survey. The data include 49,311 respondents who said "yes" when asked, "Do you, personally, identify as lesbian, gay, bisexual or transgender?" The margin of error for each year of data collection is ±0.1 percentage points at the 95% confidence level. Margins of error for population subgroups are larger depending on sample size. All reported margins of sampling error include computed design effects for weighting.
Each sample of national adults includes a minimum quota of 60% cellphone respondents and 40% landline respondents, with additional minimum quotas by time zone within region. Landline and cellular telephone numbers are selected using random-digit-dial methods.
Learn more about how Gallup Daily tracking works.