Story Highlights
- Houston led largest U.S. metro areas in 2012-2013; tied for last in 2016
- Salt Lake City had the highest score on Job Creation Index in 2016
- Salt Lake City, San Francisco and Austin, Texas, in top five for third straight year
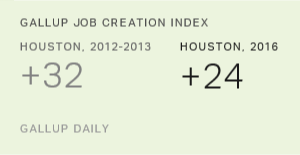
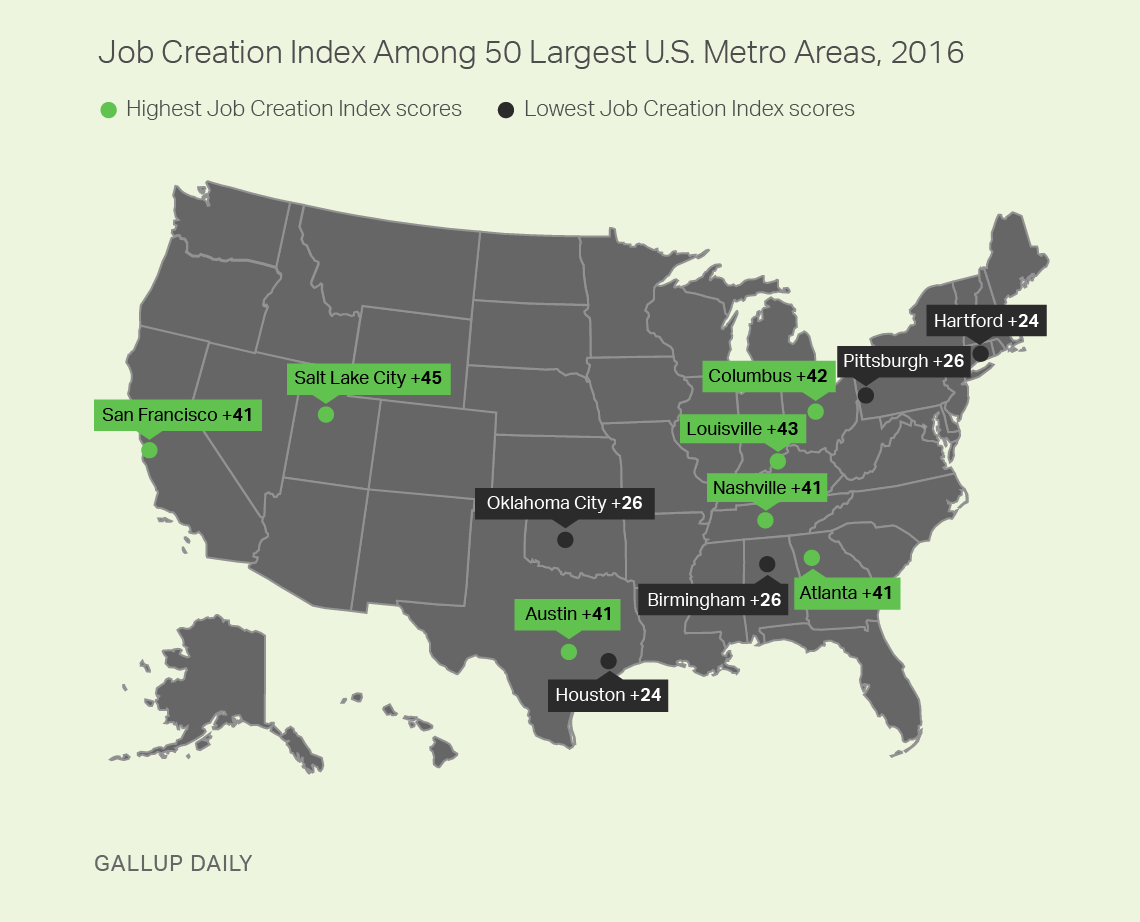
WASHINGTON, D.C. -- Houston and Hartford, Connecticut, rank last among the 50 largest U.S. metro areas on Gallup's Job Creation Index. That marks a swift reversal for Houston, which had topped the list in the 2012-2013 report. Salt Lake City is first in the rankings, based on 2016 data, with a score of +45.
Gallup's Job Creation Index is based on employees' reports of hiring activity at their place of work. As part of its daily tracking survey, Gallup asks working Americans whether their employer is hiring workers and expanding its workforce, letting workers go and reducing the size of its workforce, or not changing its employee base.
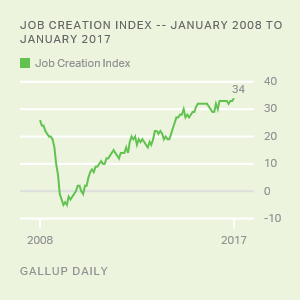
Nationally, in 2016, 43% of workers said their employer was hiring and 11% said theirs was letting workers go, resulting in a +32 score on Gallup's Job Creation Index. That represents steady improvement from a -1 score in 2009 and +20 in 2013.
Large cities and their surrounding cities and suburbs are usually major hubs of business and economic activity and thus employment. As a result, the 50 most populous metro areas have Job Creation Index scores that tend to exceed the national average. In fact, 37 of the 50 metro areas scored +33 or better in 2016.
Not only is Houston among the 12 metro areas whose job creation lags the national average, but it is also one of only two metro areas, along with Oklahoma City, whose score has not improved since 2012-2013. When Houston ranked first for job creation in 2012-2013, its score was +32; now it is +24. Oklahoma City, which ranked first in 2011 with a score of +25, had a +26 score in 2012-2013 and still does.
Houston and Oklahoma City, whose economies rely to a large degree on the energy industry, likely benefited from higher energy prices in the earlier part of the decade but may have been harmed by sustained lower prices in recent years.
Hartford, Pittsburgh and Birmingham, Alabama, join Oklahoma City and Houston in the bottom five. Hartford has been in the bottom five each of the past three years.
Although these five major metro areas trail most others in job creation, they still have relatively healthy job markets in an absolute sense, with many more workers in those areas reporting job gains than job losses where they work.
Salt Lake City, San Francisco and Austin, Texas, Among Strongest Job Markets
The highest-ranking metro areas had Job Creation Index scores of +41 or greater. These include Salt Lake City; Louisville, Kentucky; Columbus, Ohio; Atlanta; San Francisco; Austin; and Nashville, Tennessee.
Salt Lake City, San Francisco and Austin have ranked in the top five each of the past three years. All three have a significant presence in the technology industry.
Orlando, Florida, was the top metro area for job creation in 2015 and consistently ranked near the top before that. In 2016, it fell just outside the top-ranking areas, at +39.
Las Vegas also did not make the top tier of large metro areas in job creation but has shown the most improvement in recent years. In 2014, Las Vegas ranked near the bottom with a score of +21; it surged to +40 in 2016. Las Vegas' improvement has helped propel Nevada to the top of Gallup's state job creation rankings.
Complete data for each of the 50 largest metro areas appear at the end of this article.
Implications
Although the hiring situation, as assessed by front-line workers, is healthy in all major U.S. metro areas, some areas are stronger than others. Salt Lake City, Austin and San Francisco have consistently ranked among the healthiest job markets in recent years, with Hartford consistently ranking among the weakest.
A metro area's relative strength can change rapidly as the economy and job market change, which is evident in Houston's and Oklahoma City's tumbles in the rankings and Las Vegas' recent surge. Areas that hold a strong job presence in certain economic sectors, such as energy in the case of Houston and Oklahoma City and tourism in the case of Las Vegas, may be especially susceptible to volatility in the job market, and thus show departures from the broader trends observed in the rest of the country.
These data are available in Gallup Analytics.
Gallup.com reports results from these indexes in daily, weekly and monthly averages and in Gallup.com stories. Complete trend data are always available to view in the following charts:
Daily: Employment, Economic Confidence, Consumer Spending
Weekly: Employment, Economic Confidence, Job Creation, Consumer Spending
Read more about Gallup's economic measures.
View our economic release schedule.
Survey Methods
Results for this Gallup poll are based on telephone interviews conducted in 2016 on the Gallup U.S. Daily survey with a random sample of 210,448 employed adults, aged 18 and older, living in all 50 U.S. states and the District of Columbia. For results based on the total sample of working adults, the margin of sampling error is ±1 percentage point at the 95% confidence level. For results based on metro area-level data, the margin of sampling error is no more than ±4 percentage points at the 95% confidence level and is ±3 percentage points for most metro areas. Metropolitan areas are defined using Office of Management and Budget (OMB) definitions for metropolitan statistical areas (MSAs).
All reported margins of sampling error include computed design effects for weighting.
Each sample of national adults includes a minimum quota of 60% cellphone respondents and 40% landline respondents, with additional minimum quotas by time zone within region. Landline and cellular telephone numbers are selected using random-digit-dial methods.
Learn more about how the Gallup U.S. Daily works.
| Hiring workers | Not changing | Letting workers go | Job Creation Index | ||||||||||||||||||||||||||||||||||||||||||||||||||||||||||||||||||||||||||||||||||||||||||||||||
|---|---|---|---|---|---|---|---|---|---|---|---|---|---|---|---|---|---|---|---|---|---|---|---|---|---|---|---|---|---|---|---|---|---|---|---|---|---|---|---|---|---|---|---|---|---|---|---|---|---|---|---|---|---|---|---|---|---|---|---|---|---|---|---|---|---|---|---|---|---|---|---|---|---|---|---|---|---|---|---|---|---|---|---|---|---|---|---|---|---|---|---|---|---|---|---|---|---|---|---|
| % | % | % | |||||||||||||||||||||||||||||||||||||||||||||||||||||||||||||||||||||||||||||||||||||||||||||||||
| Salt Lake City, UT | 52 | 37 | 7 | +45 | |||||||||||||||||||||||||||||||||||||||||||||||||||||||||||||||||||||||||||||||||||||||||||||||
| Louisville-Jefferson County, KY-IN | 51 | 36 | 8 | +43 | |||||||||||||||||||||||||||||||||||||||||||||||||||||||||||||||||||||||||||||||||||||||||||||||
| Columbus, OH | 51 | 36 | 9 | +42 | |||||||||||||||||||||||||||||||||||||||||||||||||||||||||||||||||||||||||||||||||||||||||||||||
| Atlanta-Sandy Springs-Roswell, GA | 50 | 37 | 9 | +41 | |||||||||||||||||||||||||||||||||||||||||||||||||||||||||||||||||||||||||||||||||||||||||||||||
| Austin-Round Rock, TX | 49 | 37 | 8 | +41 | |||||||||||||||||||||||||||||||||||||||||||||||||||||||||||||||||||||||||||||||||||||||||||||||
| Nashville-Davidson-Murfreesboro-Franklin, TN | 49 | 37 | 8 | +41 | |||||||||||||||||||||||||||||||||||||||||||||||||||||||||||||||||||||||||||||||||||||||||||||||
| San Francisco-Oakland-Hayward, CA | 48 | 37 | 7 | +41 | |||||||||||||||||||||||||||||||||||||||||||||||||||||||||||||||||||||||||||||||||||||||||||||||
| Las Vegas-Henderson-Paradise, NV | 49 | 36 | 9 | +40 | |||||||||||||||||||||||||||||||||||||||||||||||||||||||||||||||||||||||||||||||||||||||||||||||
| San Jose-Sunnyvale-Santa Clara, CA | 49 | 37 | 9 | +40 | |||||||||||||||||||||||||||||||||||||||||||||||||||||||||||||||||||||||||||||||||||||||||||||||
| Charlotte-Concord-Gastonia, NC-SC | 48 | 37 | 9 | +39 | |||||||||||||||||||||||||||||||||||||||||||||||||||||||||||||||||||||||||||||||||||||||||||||||
| Cincinnati, OH-KY-IN | 48 | 39 | 9 | +39 | |||||||||||||||||||||||||||||||||||||||||||||||||||||||||||||||||||||||||||||||||||||||||||||||
| Detroit-Warren-Dearborn, MI | 49 | 38 | 10 | +39 | |||||||||||||||||||||||||||||||||||||||||||||||||||||||||||||||||||||||||||||||||||||||||||||||
| Minneapolis-St. Paul-Bloomington, MN-WI | 46 | 41 | 7 | +39 | |||||||||||||||||||||||||||||||||||||||||||||||||||||||||||||||||||||||||||||||||||||||||||||||
| Orlando-Kissimmee-Sanford, FL | 48 | 36 | 9 | +39 | |||||||||||||||||||||||||||||||||||||||||||||||||||||||||||||||||||||||||||||||||||||||||||||||
| San Antonio-New Braunfels, TX | 49 | 34 | 10 | +39 | |||||||||||||||||||||||||||||||||||||||||||||||||||||||||||||||||||||||||||||||||||||||||||||||
| Indianapolis-Carmel-Anderson, IN | 48 | 38 | 10 | +38 | |||||||||||||||||||||||||||||||||||||||||||||||||||||||||||||||||||||||||||||||||||||||||||||||
| Jacksonville, FL | 49 | 35 | 11 | +38 | |||||||||||||||||||||||||||||||||||||||||||||||||||||||||||||||||||||||||||||||||||||||||||||||
| Milwaukee-Waukesha-West Allis, WI | 49 | 38 | 11 | +38 | |||||||||||||||||||||||||||||||||||||||||||||||||||||||||||||||||||||||||||||||||||||||||||||||
| Phoenix-Mesa-Scottsdale, AZ | 48 | 35 | 10 | +38 | |||||||||||||||||||||||||||||||||||||||||||||||||||||||||||||||||||||||||||||||||||||||||||||||
| Portland-Vancouver-Hillsboro, OR-WA | 46 | 39 | 9 | +37 | |||||||||||||||||||||||||||||||||||||||||||||||||||||||||||||||||||||||||||||||||||||||||||||||
| Raleigh, NC | 49 | 36 | 12 | +37 | |||||||||||||||||||||||||||||||||||||||||||||||||||||||||||||||||||||||||||||||||||||||||||||||
| Seattle-Tacoma-Bellevue, WA | 47 | 38 | 10 | +37 | |||||||||||||||||||||||||||||||||||||||||||||||||||||||||||||||||||||||||||||||||||||||||||||||
| Dallas-Fort Worth-Arlington, TX | 47 | 37 | 11 | +36 | |||||||||||||||||||||||||||||||||||||||||||||||||||||||||||||||||||||||||||||||||||||||||||||||
| Denver-Aurora-Lakewood, CO | 46 | 39 | 10 | +36 | |||||||||||||||||||||||||||||||||||||||||||||||||||||||||||||||||||||||||||||||||||||||||||||||
| Kansas City, MO-KS | 46 | 38 | 10 | +36 | |||||||||||||||||||||||||||||||||||||||||||||||||||||||||||||||||||||||||||||||||||||||||||||||
| Memphis, TN-MS-AR | 49 | 33 | 13 | +36 | |||||||||||||||||||||||||||||||||||||||||||||||||||||||||||||||||||||||||||||||||||||||||||||||
| Richmond, VA | 45 | 40 | 9 | +36 | |||||||||||||||||||||||||||||||||||||||||||||||||||||||||||||||||||||||||||||||||||||||||||||||
| Tampa-St. Petersburg-Clearwater, FL | 46 | 38 | 10 | +36 | |||||||||||||||||||||||||||||||||||||||||||||||||||||||||||||||||||||||||||||||||||||||||||||||
| Buffalo-Cheektowaga-Niagara Falls, NY | 45 | 42 | 10 | +35 | |||||||||||||||||||||||||||||||||||||||||||||||||||||||||||||||||||||||||||||||||||||||||||||||
| Washington-Arlington-Alexandria, DC-VA-MD-WV | 45 | 39 | 10 | +35 | |||||||||||||||||||||||||||||||||||||||||||||||||||||||||||||||||||||||||||||||||||||||||||||||
| Baltimore-Columbia-Towson, MD | 46 | 37 | 12 | +34 | |||||||||||||||||||||||||||||||||||||||||||||||||||||||||||||||||||||||||||||||||||||||||||||||
| Philadelphia-Camden-Wilmington, PA-NJ-DE-MD | 45 | 38 | 11 | +34 | |||||||||||||||||||||||||||||||||||||||||||||||||||||||||||||||||||||||||||||||||||||||||||||||
| St. Louis, MO-IL | 45 | 40 | 11 | +34 | |||||||||||||||||||||||||||||||||||||||||||||||||||||||||||||||||||||||||||||||||||||||||||||||
| San Diego-Carlsbad, CA | 45 | 39 | 11 | +34 | |||||||||||||||||||||||||||||||||||||||||||||||||||||||||||||||||||||||||||||||||||||||||||||||
| Boston-Cambridge-Newton, MA-NH | 42 | 43 | 9 | +33 | |||||||||||||||||||||||||||||||||||||||||||||||||||||||||||||||||||||||||||||||||||||||||||||||
| Cleveland-Elyria, OH | 45 | 40 | 12 | +33 | |||||||||||||||||||||||||||||||||||||||||||||||||||||||||||||||||||||||||||||||||||||||||||||||
| Sacramento--Roseville--Arden-Arcade, CA | 43 | 41 | 10 | +33 | |||||||||||||||||||||||||||||||||||||||||||||||||||||||||||||||||||||||||||||||||||||||||||||||
| Riverside-San Bernardino-Ontario, CA | 43 | 38 | 11 | +32 | |||||||||||||||||||||||||||||||||||||||||||||||||||||||||||||||||||||||||||||||||||||||||||||||
| Los Angeles-Long Beach-Anaheim, CA | 42 | 39 | 11 | +31 | |||||||||||||||||||||||||||||||||||||||||||||||||||||||||||||||||||||||||||||||||||||||||||||||
| Miami-Fort Lauderdale-West Palm Beach, FL | 42 | 36 | 11 | +31 | |||||||||||||||||||||||||||||||||||||||||||||||||||||||||||||||||||||||||||||||||||||||||||||||
| Virginia Beach-Norfolk-Newport News, VA-NC | 45 | 37 | 14 | +31 | |||||||||||||||||||||||||||||||||||||||||||||||||||||||||||||||||||||||||||||||||||||||||||||||
| Chicago-Naperville-Elgin, IL-IN-WI | 43 | 39 | 13 | +30 | |||||||||||||||||||||||||||||||||||||||||||||||||||||||||||||||||||||||||||||||||||||||||||||||
| New Orleans-Metairie, LA | 41 | 40 | 12 | +29 | |||||||||||||||||||||||||||||||||||||||||||||||||||||||||||||||||||||||||||||||||||||||||||||||
| Providence-Warwick, RI-MA | 41 | 41 | 12 | +29 | |||||||||||||||||||||||||||||||||||||||||||||||||||||||||||||||||||||||||||||||||||||||||||||||
| New York-Newark-Jersey City, NY-NJ-PA | 40 | 40 | 12 | +28 | |||||||||||||||||||||||||||||||||||||||||||||||||||||||||||||||||||||||||||||||||||||||||||||||
| Birmingham-Hoover, AL | 39 | 41 | 13 | +26 | |||||||||||||||||||||||||||||||||||||||||||||||||||||||||||||||||||||||||||||||||||||||||||||||
| Oklahoma City, OK | 42 | 38 | 16 | +26 | |||||||||||||||||||||||||||||||||||||||||||||||||||||||||||||||||||||||||||||||||||||||||||||||
| Pittsburgh, PA | 39 | 44 | 13 | +26 | |||||||||||||||||||||||||||||||||||||||||||||||||||||||||||||||||||||||||||||||||||||||||||||||
| Hartford-West Hartford-East Hartford, CT | 37 | 46 | 13 | +24 | |||||||||||||||||||||||||||||||||||||||||||||||||||||||||||||||||||||||||||||||||||||||||||||||
| Houston-The Woodlands-Sugar Land, TX | 40 | 36 | 16 | +24 | |||||||||||||||||||||||||||||||||||||||||||||||||||||||||||||||||||||||||||||||||||||||||||||||
| Gallup Daily | |||||||||||||||||||||||||||||||||||||||||||||||||||||||||||||||||||||||||||||||||||||||||||||||||||
