Story Highlights
- 55% of Americans have no preference about the gender of their boss
- Men (68%) are more likely than women (44%) to lack preference
- Women under 50 prefer a female boss; women 50 and older divided
WASHINGTON, D.C. -- For the first time since Gallup began measuring Americans' preferences about the gender of their boss, a majority say their boss' gender makes no difference to them. Those who do have a preference are now evenly divided between male and female bosses, also a first in Gallup's trend. The percentage of U.S. adults preferring a male boss is now 23%, 10 percentage points lower than the last reading in 2014 and 43 points lower than the initial 1953 reading.
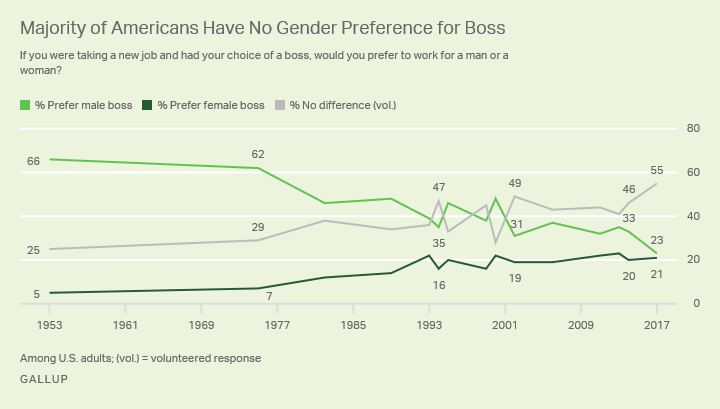
Currently, 55% of Americans volunteer that they would have no gender preference for a boss if they were taking a new job. Roughly equal percentages, 23% and 21%, say they would prefer a man or a woman, respectively. In the 1980s, male bosses held as much as a 34-point advantage over female bosses, making the current (and statistically insignificant) two-point difference notable.
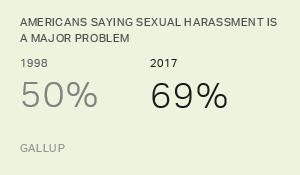
The most recent survey was conducted Nov. 2-8, about a month after multiple women accused Hollywood producer Harvey Weinstein of sexual harassment. In the weeks following the allegations against Weinstein, at least 20 other prominent men across a variety of industries have been accused of sexual harassment.
The public's current break from its decades-long preference for male bosses could be a sign that recent news events have had an effect, although the shift could have occurred anytime within the past three years since the question was last asked.

Improve Your Workplace
Be exceptional. Attract, hire and retain top performers.
Women and Men Differ in Gender Preferences for a Boss
Women and men are both less likely to prefer a male boss and more likely to not have any gender preference compared with 2014.
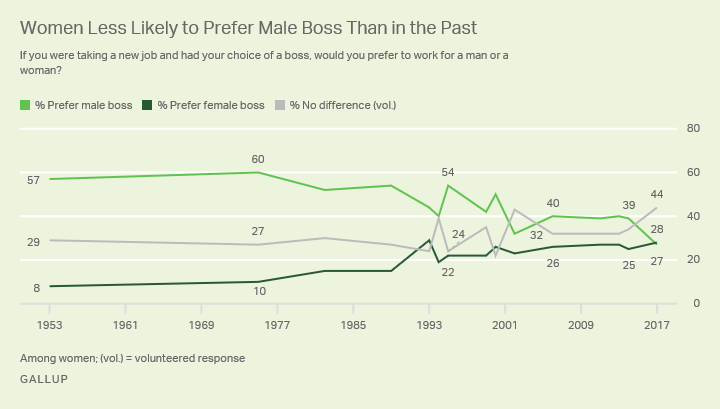
Since 1982, women have consistently been more likely than men to say they prefer a male boss. While that general trend persists, a historically low 27% of women now express a preference for a male boss, a 12-point drop from 2014. While women's preference for a female boss has not changed meaningfully over the past 17 years, there has instead been an increase since then in the percentage of women who say their boss' gender makes no difference. Currently, 28% prefer a female boss and 44% do not have a preference.
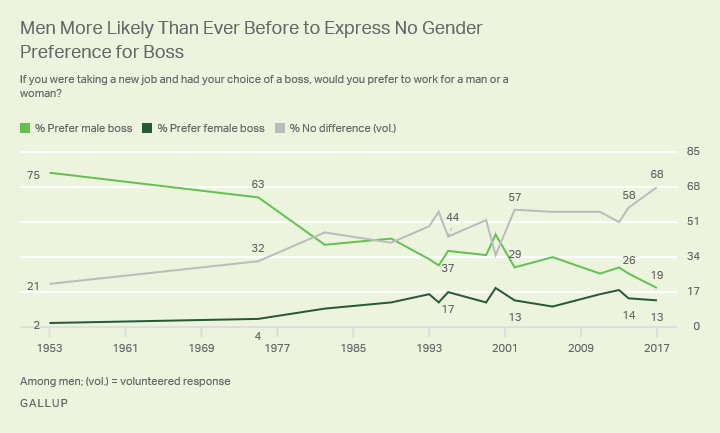
For their part, men have become significantly less likely over time to indicate a preference for a male boss -- and like women, men have become more likely to say the gender of their boss makes no difference. The percentage of men favoring a female boss hasn't changed in recent years.
Preferences Differ by Gender, Age and Party Identification
Since 2014 when Gallup last asked the gender preference question, there has been a universal decline in support for male bosses among all subgroups, although some have declined more than others. Some key differences between subgroups remain.
Americans younger than 35 prefer a female boss over a male boss by 14 points, while half say they have no preference. And although women overall are divided in their gender preferences, women younger than 50 are more likely to prefer a woman, while men younger than 50 are divided. Democrats tilt slightly toward favoring a female boss, but Republicans favor a male boss by 13 points. Those who are currently employed are more likely to say their gender preference is the same as their current boss.
| Prefer male boss | Prefer female boss | No difference (vol.) | ||||||||||||||||||||||||||||||||||||||||||||||||||||||||||||||||||||||||||||||||||||||||||||||||||
|---|---|---|---|---|---|---|---|---|---|---|---|---|---|---|---|---|---|---|---|---|---|---|---|---|---|---|---|---|---|---|---|---|---|---|---|---|---|---|---|---|---|---|---|---|---|---|---|---|---|---|---|---|---|---|---|---|---|---|---|---|---|---|---|---|---|---|---|---|---|---|---|---|---|---|---|---|---|---|---|---|---|---|---|---|---|---|---|---|---|---|---|---|---|---|---|---|---|---|---|---|
| % | % | % | ||||||||||||||||||||||||||||||||||||||||||||||||||||||||||||||||||||||||||||||||||||||||||||||||||
| Gender | ||||||||||||||||||||||||||||||||||||||||||||||||||||||||||||||||||||||||||||||||||||||||||||||||||||
| Men | 19 | 13 | 68 | |||||||||||||||||||||||||||||||||||||||||||||||||||||||||||||||||||||||||||||||||||||||||||||||||
| Women | 27 | 28 | 44 | |||||||||||||||||||||||||||||||||||||||||||||||||||||||||||||||||||||||||||||||||||||||||||||||||
| Annual household income | ||||||||||||||||||||||||||||||||||||||||||||||||||||||||||||||||||||||||||||||||||||||||||||||||||||
| <$30,000 | 29 | 25 | 44 | |||||||||||||||||||||||||||||||||||||||||||||||||||||||||||||||||||||||||||||||||||||||||||||||||
| $30,000-<$75,000 | 24 | 18 | 58 | |||||||||||||||||||||||||||||||||||||||||||||||||||||||||||||||||||||||||||||||||||||||||||||||||
| $75,000+ | 20 | 20 | 60 | |||||||||||||||||||||||||||||||||||||||||||||||||||||||||||||||||||||||||||||||||||||||||||||||||
| Age and gender | ||||||||||||||||||||||||||||||||||||||||||||||||||||||||||||||||||||||||||||||||||||||||||||||||||||
| Men, 18-49 | 17 | 16 | 67 | |||||||||||||||||||||||||||||||||||||||||||||||||||||||||||||||||||||||||||||||||||||||||||||||||
| Men, 50+ | 22 | 10 | 67 | |||||||||||||||||||||||||||||||||||||||||||||||||||||||||||||||||||||||||||||||||||||||||||||||||
| Women, 18-49 | 25 | 31 | 42 | |||||||||||||||||||||||||||||||||||||||||||||||||||||||||||||||||||||||||||||||||||||||||||||||||
| Women, 50+ | 28 | 25 | 44 | |||||||||||||||||||||||||||||||||||||||||||||||||||||||||||||||||||||||||||||||||||||||||||||||||
| Party ID | ||||||||||||||||||||||||||||||||||||||||||||||||||||||||||||||||||||||||||||||||||||||||||||||||||||
| Republicans | 28 | 15 | 54 | |||||||||||||||||||||||||||||||||||||||||||||||||||||||||||||||||||||||||||||||||||||||||||||||||
| Democrats | 23 | 28 | 49 | |||||||||||||||||||||||||||||||||||||||||||||||||||||||||||||||||||||||||||||||||||||||||||||||||
| Independents | 20 | 20 | 60 | |||||||||||||||||||||||||||||||||||||||||||||||||||||||||||||||||||||||||||||||||||||||||||||||||
| Current boss | ||||||||||||||||||||||||||||||||||||||||||||||||||||||||||||||||||||||||||||||||||||||||||||||||||||
| Employed, with male boss | 27 | 11 | 62 | |||||||||||||||||||||||||||||||||||||||||||||||||||||||||||||||||||||||||||||||||||||||||||||||||
| Employed, with female boss | 18 | 31 | 50 | |||||||||||||||||||||||||||||||||||||||||||||||||||||||||||||||||||||||||||||||||||||||||||||||||
| Gallup, Nov. 2-8, 2017 | ||||||||||||||||||||||||||||||||||||||||||||||||||||||||||||||||||||||||||||||||||||||||||||||||||||
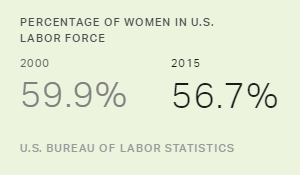
While the public's acceptance of women as bosses (including those who prefer a female boss or say they have no gender preference) has been at the majority level since the early 1990s, change has been slow in workplaces. The percentage of employed Americans who say they have a female boss has not changed significantly since 2011. Currently, 32% of those working full or part time say they have a female boss, and 52% have a male boss.
Bottom Line
Since the early 1980s, the preferences among both men and women for a male boss have each fallen by 50%. The abrupt shift since 2014 in the percentage of Americans preferring a male boss suggests that the public may be reacting to the seemingly endless stream of sexual harassment allegations against men in workplaces across many industries, from Hollywood to Capitol Hill.
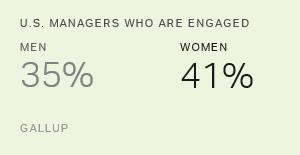
Just as the percentage of employed Americans working for a female boss hasn't changed much in recent years, women remain scarce in upper management levels. In June, Fortune reported that 32 CEOs of Fortune 500 companies are women. While this marks the highest proportion of female CEOs in the history of the Fortune 500, there is clearly room for more women to enter top management tiers at America's largest corporations. In fact, Gallup research has found that workers with female bosses are more engaged than those with male bosses.
As high-profile men accused of sexual harassment in the workplace resign or are fired, employers might consider replacing them with women. Most Americans no longer prefer male bosses.
Survey Methods
Results for this Gallup poll are based on telephone interviews conducted Nov. 2-8, 2017, with a random sample of 1,028 adults, aged 18 and older, living in all 50 U.S. states and the District of Columbia. For results based on the total sample of national adults, the margin of sampling error is ±4 percentage points at the 95% confidence level. All reported margins of sampling error include computed design effects for weighting.
Each sample of national adults includes a minimum quota of 70% cellphone respondents and 30% landline respondents, with additional minimum quotas by time zone within region. Landline and cellular telephone numbers are selected using random-digit-dial methods.
View survey methodology, complete question responses and trends.
Learn more about how the Gallup Poll Social Series works.