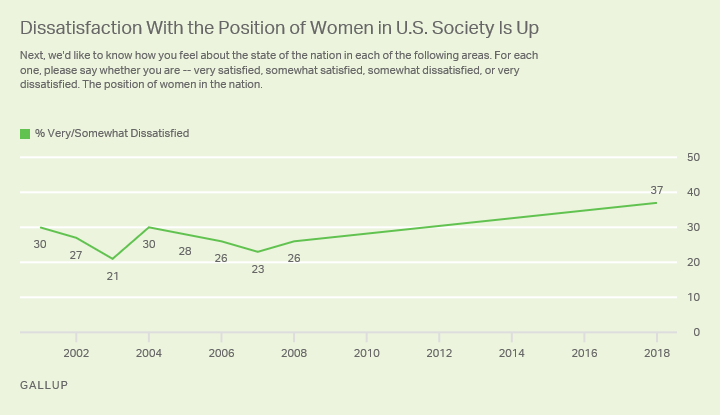
Nearly four in 10 Americans say they are "very" or "somewhat" dissatisfied with the position of women in the U.S., the highest since Gallup first asked the question in 2001.

Background: The year 2017 turned a sharper focus on women in U.S. society, from the Women's March on Washington to the "Me Too" movement drawing attention to allegations of sexual harassment and abuse, and the "Time's Up" movement's focus on gender equity in show business and business more generally. Gallup's update on a question that asks Americans about their satisfaction with the position of women in society reflects this focus, with a significantly larger percentage now saying that they are dissatisfied than in 2001 to 2008 when these questions were last asked.
U.S. women are substantially more dissatisfied with the position of women in society. Nearly half of women (46%) say they are very or somewhat dissatisfied with their position in society, up from 30% in 2008, when Gallup last asked the question (and the trend's highest point.) Dissatisfaction is also up among men, although at significantly lower levels than among women.
| 2008 | 2018 | |||||||||||||||||||||||||||||||||||||||||||||||||||||||||||||||||||||||||||||||||||||||||||||||||||
|---|---|---|---|---|---|---|---|---|---|---|---|---|---|---|---|---|---|---|---|---|---|---|---|---|---|---|---|---|---|---|---|---|---|---|---|---|---|---|---|---|---|---|---|---|---|---|---|---|---|---|---|---|---|---|---|---|---|---|---|---|---|---|---|---|---|---|---|---|---|---|---|---|---|---|---|---|---|---|---|---|---|---|---|---|---|---|---|---|---|---|---|---|---|---|---|---|---|---|---|---|
| % | % | |||||||||||||||||||||||||||||||||||||||||||||||||||||||||||||||||||||||||||||||||||||||||||||||||||
| All Americans | 26 | 37 | ||||||||||||||||||||||||||||||||||||||||||||||||||||||||||||||||||||||||||||||||||||||||||||||||||
| Gender | ||||||||||||||||||||||||||||||||||||||||||||||||||||||||||||||||||||||||||||||||||||||||||||||||||||
| Men | 21 | 28 | ||||||||||||||||||||||||||||||||||||||||||||||||||||||||||||||||||||||||||||||||||||||||||||||||||
| Women | 30 | 46 | ||||||||||||||||||||||||||||||||||||||||||||||||||||||||||||||||||||||||||||||||||||||||||||||||||
| Political Affiliation | ||||||||||||||||||||||||||||||||||||||||||||||||||||||||||||||||||||||||||||||||||||||||||||||||||||
| Republicans/Leaners | 16 | 16 | ||||||||||||||||||||||||||||||||||||||||||||||||||||||||||||||||||||||||||||||||||||||||||||||||||
| Democrats/Leaners | 34 | 55 | ||||||||||||||||||||||||||||||||||||||||||||||||||||||||||||||||||||||||||||||||||||||||||||||||||
| Political Affiliation and Gender | ||||||||||||||||||||||||||||||||||||||||||||||||||||||||||||||||||||||||||||||||||||||||||||||||||||
| Republican Men | 15 | 15 | ||||||||||||||||||||||||||||||||||||||||||||||||||||||||||||||||||||||||||||||||||||||||||||||||||
| Republican Women | 18 | 18 | ||||||||||||||||||||||||||||||||||||||||||||||||||||||||||||||||||||||||||||||||||||||||||||||||||
| Democrat Men | 29 | 43 | ||||||||||||||||||||||||||||||||||||||||||||||||||||||||||||||||||||||||||||||||||||||||||||||||||
| Democrat Women | 38 | 62 | ||||||||||||||||||||||||||||||||||||||||||||||||||||||||||||||||||||||||||||||||||||||||||||||||||
| Gallup | ||||||||||||||||||||||||||||||||||||||||||||||||||||||||||||||||||||||||||||||||||||||||||||||||||||
More than half of Democrats are dissatisfied with the position of women in the U.S. Fifty-five percent of Democrats and independents who lean Democrat are very or somewhat dissatisfied with the position of women, a 21-percentage-point increase from 2008. On the other hand, 16% of Republicans say they are very or somewhat dissatisfied with the position of women in society, which is unchanged from 2008.
The increase in dissatisfaction with the position of women among Democrats is mostly, but not entirely, driven by Democratic women. Between 2008 and 2018, dissatisfaction among women who are Democrats or lean Democratic nearly doubled, rising from 38% to 62%. Dissatisfaction among men who are Democrats or lean Democratic is also up, but not by nearly as much, increasing from 29% to 43%.
Survey Methods
Results for this Gallup poll are based on telephone interviews conducted January 2-7, 2018, with a random sample of 1,024 adults, aged 18 and older, living in all 50 U.S. states and the District of Columbia. For results based on the total sample of national adults, the margin of sampling error is ±4 percentage points at the 95% confidence level. All reported margins of sampling error include computed design effects for weighting.
Each sample of national adults includes a minimum quota of 70% cellphone respondents and 30% landline respondents, with additional minimum quotas by time zone within region. Landline and cellular telephone numbers are selected using random-digit-dial methods.
Learn more about how the Gallup Poll Social Series works.


