Story Highlights
- Protestants remain dominant in Southern states
- Catholics most prevalent in Eastern, Midwestern states
- States with highest "no religion" identity in Northern corners of nation
WASHINGTON, D.C. -- Americans continue to be geographically segregated by religion. Protestants dominate in the South, while Catholics are most common in the Northeast and mid-Atlantic, with some representation in the Midwest. Americans with no formal religious identity are most likely to be found in the West and in New England. Two smaller religious groups are also geographically concentrated: Mormons are a major population factor in Utah and Idaho, and Jews tend to be disproportionately located on the East Coast.
This geographic spread has been fairly constant over the nine years Gallup has tracked it. One notable change: As the percentage of Americans with no religious identity has gone up, the percentage of Protestants and Catholics in most states has gone down.
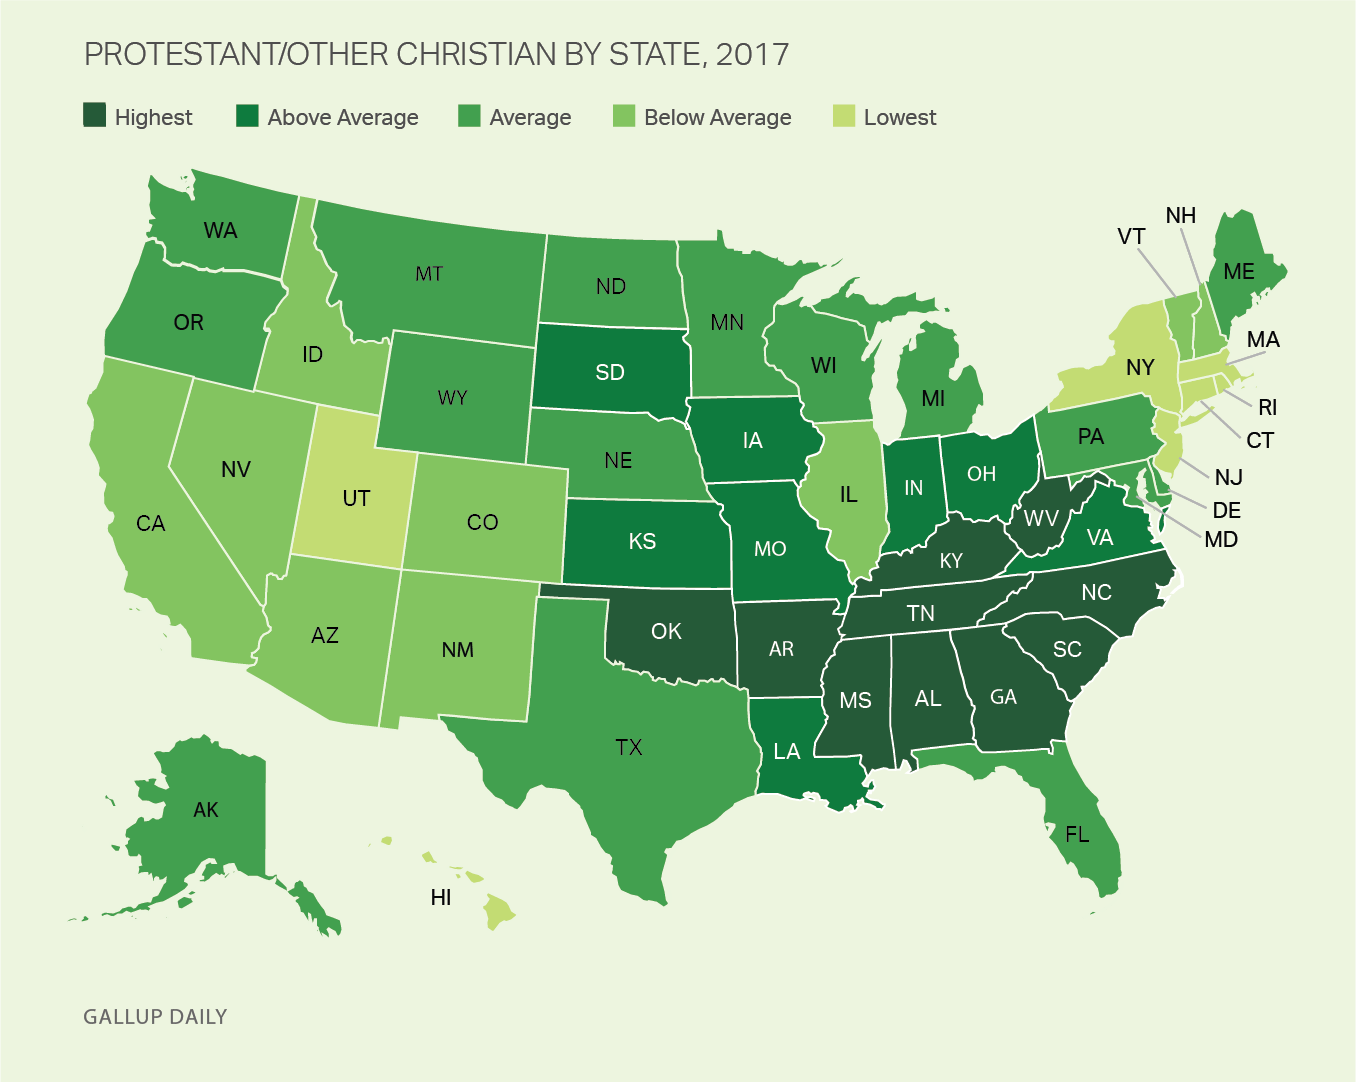
Protestants Concentrated in the South
About half of Americans (48%) identify as Protestants or other Christians who are not Catholic or Mormon. Protestants have long been a fixture of the Southern Bible Belt and that trend continued in 2017. The 10 most Protestant states are all in the South, led by Alabama and Mississippi, with 77% and 75% Protestant identification, respectively. Other states with 70% or higher Protestant residents include Arkansas, Tennessee and South Carolina.
| Protestant | |||||||||||||||||||||||||||||||||||||||||||||||||||||||||||||||||||||||||||||||||||||||||||||||||||
|---|---|---|---|---|---|---|---|---|---|---|---|---|---|---|---|---|---|---|---|---|---|---|---|---|---|---|---|---|---|---|---|---|---|---|---|---|---|---|---|---|---|---|---|---|---|---|---|---|---|---|---|---|---|---|---|---|---|---|---|---|---|---|---|---|---|---|---|---|---|---|---|---|---|---|---|---|---|---|---|---|---|---|---|---|---|---|---|---|---|---|---|---|---|---|---|---|---|---|---|
| % | |||||||||||||||||||||||||||||||||||||||||||||||||||||||||||||||||||||||||||||||||||||||||||||||||||
| Alabama | 77 | ||||||||||||||||||||||||||||||||||||||||||||||||||||||||||||||||||||||||||||||||||||||||||||||||||
| Mississippi | 75 | ||||||||||||||||||||||||||||||||||||||||||||||||||||||||||||||||||||||||||||||||||||||||||||||||||
| Arkansas | 72 | ||||||||||||||||||||||||||||||||||||||||||||||||||||||||||||||||||||||||||||||||||||||||||||||||||
| Tennessee | 71 | ||||||||||||||||||||||||||||||||||||||||||||||||||||||||||||||||||||||||||||||||||||||||||||||||||
| South Carolina | 70 | ||||||||||||||||||||||||||||||||||||||||||||||||||||||||||||||||||||||||||||||||||||||||||||||||||
| Oklahoma | 68 | ||||||||||||||||||||||||||||||||||||||||||||||||||||||||||||||||||||||||||||||||||||||||||||||||||
| West Virginia | 66 | ||||||||||||||||||||||||||||||||||||||||||||||||||||||||||||||||||||||||||||||||||||||||||||||||||
| North Carolina | 66 | ||||||||||||||||||||||||||||||||||||||||||||||||||||||||||||||||||||||||||||||||||||||||||||||||||
| Georgia | 66 | ||||||||||||||||||||||||||||||||||||||||||||||||||||||||||||||||||||||||||||||||||||||||||||||||||
| Kentucky | 63 | ||||||||||||||||||||||||||||||||||||||||||||||||||||||||||||||||||||||||||||||||||||||||||||||||||
| GALLUP Daily Tracking | |||||||||||||||||||||||||||||||||||||||||||||||||||||||||||||||||||||||||||||||||||||||||||||||||||
In a number of states, one-third or less of residents identify as Protestants, mainly in states with high representations of Catholics, Mormons or those with no religious identity. The single least Protestant state in the nation is Utah, with only 12% Protestant identification, reflecting that state's majority Mormon population.
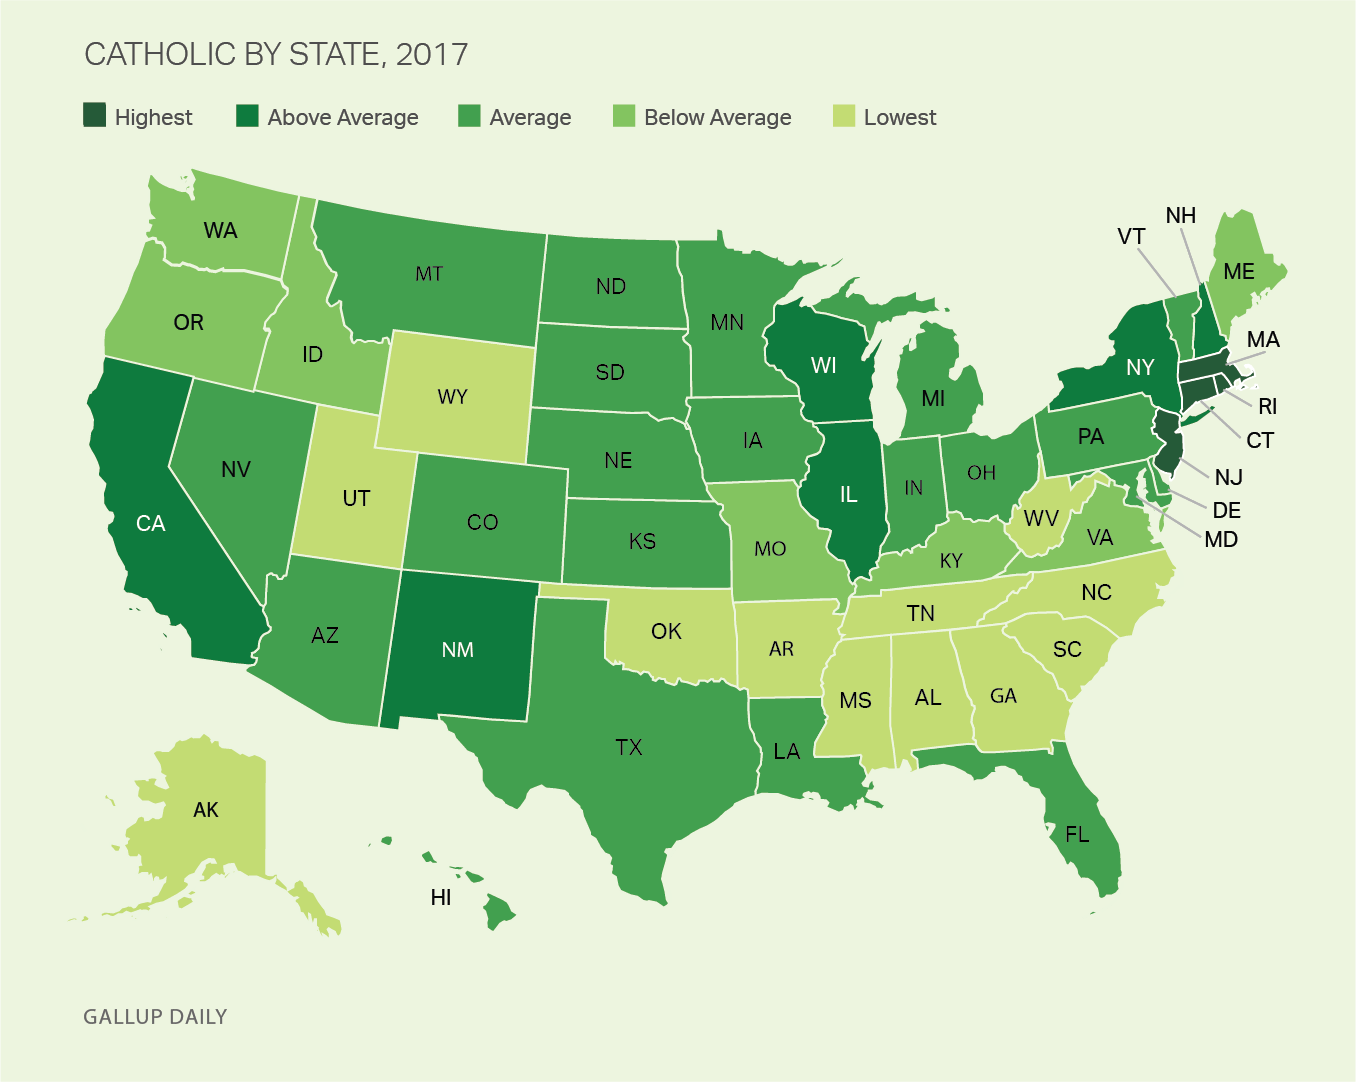
Catholics Live in East, Midwest
Twenty-three percent of all Americans identify as Catholics, but there is wide variation in Catholic representation across states -- ranging from 44% in Rhode Island, the most Catholic state in the nation, to 6% in Alabama.
| Catholic | |||||||||||||||||||||||||||||||||||||||||||||||||||||||||||||||||||||||||||||||||||||||||||||||||||
|---|---|---|---|---|---|---|---|---|---|---|---|---|---|---|---|---|---|---|---|---|---|---|---|---|---|---|---|---|---|---|---|---|---|---|---|---|---|---|---|---|---|---|---|---|---|---|---|---|---|---|---|---|---|---|---|---|---|---|---|---|---|---|---|---|---|---|---|---|---|---|---|---|---|---|---|---|---|---|---|---|---|---|---|---|---|---|---|---|---|---|---|---|---|---|---|---|---|---|---|
| % | |||||||||||||||||||||||||||||||||||||||||||||||||||||||||||||||||||||||||||||||||||||||||||||||||||
| Rhode Island | 44 | ||||||||||||||||||||||||||||||||||||||||||||||||||||||||||||||||||||||||||||||||||||||||||||||||||
| New Jersey | 40 | ||||||||||||||||||||||||||||||||||||||||||||||||||||||||||||||||||||||||||||||||||||||||||||||||||
| Connecticut | 38 | ||||||||||||||||||||||||||||||||||||||||||||||||||||||||||||||||||||||||||||||||||||||||||||||||||
| Massachusetts | 38 | ||||||||||||||||||||||||||||||||||||||||||||||||||||||||||||||||||||||||||||||||||||||||||||||||||
| New York | 34 | ||||||||||||||||||||||||||||||||||||||||||||||||||||||||||||||||||||||||||||||||||||||||||||||||||
| New Mexico | 30 | ||||||||||||||||||||||||||||||||||||||||||||||||||||||||||||||||||||||||||||||||||||||||||||||||||
| Illinois | 30 | ||||||||||||||||||||||||||||||||||||||||||||||||||||||||||||||||||||||||||||||||||||||||||||||||||
| New Hampshire | 30 | ||||||||||||||||||||||||||||||||||||||||||||||||||||||||||||||||||||||||||||||||||||||||||||||||||
| California | 29 | ||||||||||||||||||||||||||||||||||||||||||||||||||||||||||||||||||||||||||||||||||||||||||||||||||
| Wisconsin | 29 | ||||||||||||||||||||||||||||||||||||||||||||||||||||||||||||||||||||||||||||||||||||||||||||||||||
| Gallup Daily Tracking | |||||||||||||||||||||||||||||||||||||||||||||||||||||||||||||||||||||||||||||||||||||||||||||||||||
In addition to Rhode Island, the three other most Catholic states are located in New England (Connecticut and Massachusetts) and the Mid-Atlantic (New Jersey). Other states with above-average Catholic representation include New York and New Hampshire, and then several more geographically dispersed states including New Mexico, Illinois, California and Wisconsin.
"No Religious Identity" States Cluster in Northern Corners
One of the most significant trends in American religion in recent years has been the increase in the percentage of Americans who have no formal religious identity, rising from 15% in 2008 to 21% in 2017. These so-called "nones" are most prevalent in the two most Western states of the U.S., Hawaii and Alaska, and also constitute relatively high proportions of the population in a number of other Western and New England states: Washington, Vermont, Oregon, Maine, Colorado, New Hampshire and California. States in the northern corners of the U.S. have historically been the least religious in the nation based on measures of church attendance and self-reported importance of religion.
| No Religion | |||||||||||||||||||||||||||||||||||||||||||||||||||||||||||||||||||||||||||||||||||||||||||||||||||
|---|---|---|---|---|---|---|---|---|---|---|---|---|---|---|---|---|---|---|---|---|---|---|---|---|---|---|---|---|---|---|---|---|---|---|---|---|---|---|---|---|---|---|---|---|---|---|---|---|---|---|---|---|---|---|---|---|---|---|---|---|---|---|---|---|---|---|---|---|---|---|---|---|---|---|---|---|---|---|---|---|---|---|---|---|---|---|---|---|---|---|---|---|---|---|---|---|---|---|---|
| % | |||||||||||||||||||||||||||||||||||||||||||||||||||||||||||||||||||||||||||||||||||||||||||||||||||
| Hawaii | 33 | ||||||||||||||||||||||||||||||||||||||||||||||||||||||||||||||||||||||||||||||||||||||||||||||||||
| Alaska | 33 | ||||||||||||||||||||||||||||||||||||||||||||||||||||||||||||||||||||||||||||||||||||||||||||||||||
| Washington | 32 | ||||||||||||||||||||||||||||||||||||||||||||||||||||||||||||||||||||||||||||||||||||||||||||||||||
| Vermont | 32 | ||||||||||||||||||||||||||||||||||||||||||||||||||||||||||||||||||||||||||||||||||||||||||||||||||
| Oregon | 31 | ||||||||||||||||||||||||||||||||||||||||||||||||||||||||||||||||||||||||||||||||||||||||||||||||||
| Maine | 31 | ||||||||||||||||||||||||||||||||||||||||||||||||||||||||||||||||||||||||||||||||||||||||||||||||||
| Colorado | 30 | ||||||||||||||||||||||||||||||||||||||||||||||||||||||||||||||||||||||||||||||||||||||||||||||||||
| New Hampshire | 30 | ||||||||||||||||||||||||||||||||||||||||||||||||||||||||||||||||||||||||||||||||||||||||||||||||||
| California | 28 | ||||||||||||||||||||||||||||||||||||||||||||||||||||||||||||||||||||||||||||||||||||||||||||||||||
| Gallup Daily Tracking | |||||||||||||||||||||||||||||||||||||||||||||||||||||||||||||||||||||||||||||||||||||||||||||||||||
New York Most Jewish State, at 8%
Americans who identify their religion as Jewish are a small percentage of the U.S. adult population -- about 2% in 2017. On a relative basis, Jews are most prevalent in the Mid-Atlantic and New England states, including New York with 8% Jewish population, the highest in the nation, followed by New Jersey, Massachusetts, Connecticut and Maryland. Many states -- mostly in the South or the West -- have so few Jewish residents that their percentage of the population rounds to zero.
| Jewish | |||||||||||||||||||||||||||||||||||||||||||||||||||||||||||||||||||||||||||||||||||||||||||||||||||
|---|---|---|---|---|---|---|---|---|---|---|---|---|---|---|---|---|---|---|---|---|---|---|---|---|---|---|---|---|---|---|---|---|---|---|---|---|---|---|---|---|---|---|---|---|---|---|---|---|---|---|---|---|---|---|---|---|---|---|---|---|---|---|---|---|---|---|---|---|---|---|---|---|---|---|---|---|---|---|---|---|---|---|---|---|---|---|---|---|---|---|---|---|---|---|---|---|---|---|---|
| % | |||||||||||||||||||||||||||||||||||||||||||||||||||||||||||||||||||||||||||||||||||||||||||||||||||
| New York | 8 | ||||||||||||||||||||||||||||||||||||||||||||||||||||||||||||||||||||||||||||||||||||||||||||||||||
| New Jersey | 6 | ||||||||||||||||||||||||||||||||||||||||||||||||||||||||||||||||||||||||||||||||||||||||||||||||||
| Massachusetts | 5 | ||||||||||||||||||||||||||||||||||||||||||||||||||||||||||||||||||||||||||||||||||||||||||||||||||
| Connecticut | 4 | ||||||||||||||||||||||||||||||||||||||||||||||||||||||||||||||||||||||||||||||||||||||||||||||||||
| Maryland | 4 | ||||||||||||||||||||||||||||||||||||||||||||||||||||||||||||||||||||||||||||||||||||||||||||||||||
| Florida | 3 | ||||||||||||||||||||||||||||||||||||||||||||||||||||||||||||||||||||||||||||||||||||||||||||||||||
| Vermont | 3 | ||||||||||||||||||||||||||||||||||||||||||||||||||||||||||||||||||||||||||||||||||||||||||||||||||
| California | 3 | ||||||||||||||||||||||||||||||||||||||||||||||||||||||||||||||||||||||||||||||||||||||||||||||||||
| Gallup Daily Tracking | |||||||||||||||||||||||||||||||||||||||||||||||||||||||||||||||||||||||||||||||||||||||||||||||||||
Utah, Idaho Have Highest Percentage of Mormons
Mormons -- or members of the Church of Jesus Christ of Latter-day Saints -- constitute about 2% of the U.S. population, but are the majority of the population in Utah and a relatively high percentage of the population in the neighboring state of Idaho.
Today, 55% of the residents of Utah identify as Mormon, slightly lower than the 59% Gallup tracked in 2008. Mormons also make up 18% of the population of Idaho, with 6% or less representation in all other states. Six states have between 3% and 6% Mormon population, all of which are in the West. As is the case for the Jewish population, many states have so few Mormon residents that their percentage in the state population rounds to zero -- mainly states with high percentages of Protestants and Catholics in the South and East.
| Mormon | |||||||||||||||||||||||||||||||||||||||||||||||||||||||||||||||||||||||||||||||||||||||||||||||||||
|---|---|---|---|---|---|---|---|---|---|---|---|---|---|---|---|---|---|---|---|---|---|---|---|---|---|---|---|---|---|---|---|---|---|---|---|---|---|---|---|---|---|---|---|---|---|---|---|---|---|---|---|---|---|---|---|---|---|---|---|---|---|---|---|---|---|---|---|---|---|---|---|---|---|---|---|---|---|---|---|---|---|---|---|---|---|---|---|---|---|---|---|---|---|---|---|---|---|---|---|
| % | |||||||||||||||||||||||||||||||||||||||||||||||||||||||||||||||||||||||||||||||||||||||||||||||||||
| Utah | 55 | ||||||||||||||||||||||||||||||||||||||||||||||||||||||||||||||||||||||||||||||||||||||||||||||||||
| Idaho | 18 | ||||||||||||||||||||||||||||||||||||||||||||||||||||||||||||||||||||||||||||||||||||||||||||||||||
| Wyoming | 6 | ||||||||||||||||||||||||||||||||||||||||||||||||||||||||||||||||||||||||||||||||||||||||||||||||||
| Nevada | 6 | ||||||||||||||||||||||||||||||||||||||||||||||||||||||||||||||||||||||||||||||||||||||||||||||||||
| Hawaii | 4 | ||||||||||||||||||||||||||||||||||||||||||||||||||||||||||||||||||||||||||||||||||||||||||||||||||
| Alaska | 4 | ||||||||||||||||||||||||||||||||||||||||||||||||||||||||||||||||||||||||||||||||||||||||||||||||||
| Montana | 4 | ||||||||||||||||||||||||||||||||||||||||||||||||||||||||||||||||||||||||||||||||||||||||||||||||||
| Arizona | 4 | ||||||||||||||||||||||||||||||||||||||||||||||||||||||||||||||||||||||||||||||||||||||||||||||||||
| Washington | 3 | ||||||||||||||||||||||||||||||||||||||||||||||||||||||||||||||||||||||||||||||||||||||||||||||||||
| Oregon | 3 | ||||||||||||||||||||||||||||||||||||||||||||||||||||||||||||||||||||||||||||||||||||||||||||||||||
| Gallup Daily Tracking | |||||||||||||||||||||||||||||||||||||||||||||||||||||||||||||||||||||||||||||||||||||||||||||||||||
Bottom Line
Gallup began its analysis of religious identity at the state level in 2008, based on daily tracking surveys that allowed the accumulation of significant samples of residents in each state. While there have been some changes in the precise representation of religious groups on a state by state basis since then, the general patterns have remained the same.
Protestants are most represented in the South, Catholics in the East and to some degree the Midwest, Mormons in Utah and Idaho, and Jews in Eastern states. Those with no religious identity are most likely to live in the northern corners of the county, plus in Hawaii. The major shift in recent years has been a seven-percentage-point increase in the percentage of Americans who say they have no formal religious identity nationwide, which also has been evident in most individual states.
The diverse geographic distribution of religions across the states reflects complex historical patterns. The distribution of Catholics results in part from historical patterns of migration into the U.S., along with the higher population of Hispanics, whose most common religious identity is Catholic, in certain states. Protestant domination in the South reflects the lack of large-scale migration of Catholics to those states, the higher levels of overall religiosity in the South that keep the percentages of "nones" down, and the relatively high dominantly Protestant black population in Southern states. The high percentage of Mormons in Utah is a straightforward manifestation of Mormon leaders' decisions to flee persecution and move to the Salt Lake Basin in Utah Territory in the 1800s.
The explanation for why Americans with no formal religious identity cluster in the Northwestern and Northeastern parts of the country is less straightforward, but most likely represents historical cultural norms in these areas, and lower levels of religiosity among the people who have decided to move there over the years.
Survey Methods
Results for this Gallup poll are based on telephone interviews conducted Jan. 2-Dec. 30, 2017, on the Gallup U.S. Daily survey, with a random sample of 130,959 adults, aged 18 and older, living in all 50 U.S. states and the District of Columbia. For results based on the total sample of national adults, the margin of sampling error is ±1 percentage point at the 95% confidence level.
Margins of error for individual states are no greater than ±6 percentage points and are ±3 percentage points in most states. All reported margins of sampling error include computed design effects for weighting.
Each sample of national adults includes a minimum quota of 70% cellphone respondents and 30% landline respondents, with additional minimum quotas by time zone within region. Landline and cellular telephone numbers are selected using random-digit-dial methods.
Learn more about how the Gallup U.S. Daily works.