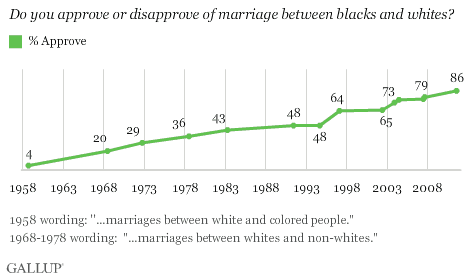
PRINCETON, NJ -- Americans are approaching unanimity in their views of marriages between blacks and whites, with 86% now approving of such unions. Americans' views on interracial marriage have undergone a major transformation in the past five decades. When Gallup first asked about black-white marriages in 1958, 4% approved. More Americans disapproved than approved until 1983, and approval did not exceed the majority level until 1997.

The latest results are based on an Aug. 4-7 USA Today/Gallup poll, which included an oversample of blacks.
Approval of black-white marriages is at a record high among blacks and whites. Blacks have always been more approving than whites of interracial marriage, going back to 1968 when Gallup first was able to report reliable estimates on each group's opinions. However, the gap in approval ratings has narrowed considerably, averaging 13 percentage points since 1997 but 32 points from 1968-1994.

Wide Generation Gap in Views of Black-White Marriage
Approval of black-white marriage is well above the majority level among all key subgroups, though slightly lower among Southerners, Republicans, conservatives, and those with no college education. Senior citizens are the least approving of black-white marriage among major subgroups, at 66%.

Today's older Americans, those aged 50 and older, are much more likely to approve of black-white marriage than people of the same age a generation ago; 78% today vs. 27% in 1991, a 51-point shift. At the same time, there has also been a 33-point increase among 18- to 29-year-olds (64% to 97%) and a 35-point increase among 30- to 49-year-olds (from 56% to 91%) between the two time periods.
The increase in approval of black-white marriage among all Americans, however, is probably more the result of changing attitudes within the population than it is changes in the composition of the population with more socially progressive younger adults replacing less progressive older ones. This is evident from examining the same age cohorts in 1991 and now. Each cohort shows 30 point or more increases in approval of black-white marriage today compared with the same group's attitudes 20 years ago.

However, generational replacement is still a factor as today's younger Americans, who were children or not even born 20 years ago and are nearly unanimous in their approval of black-white marriage, are replacing now-deceased Americans who were generally less likely to approve of interracial marriage when they were alive.
Implications
Americans' acceptance of marriage between people of different races continues to grow and is approaching unanimity, with 86% now approving of marriages between blacks and whites. Widespread approval of interracial marriage is a dramatic shift from roughly 50 years ago when 4% approved, and even 20 years ago, when about half as many approved as do so today.
The trend mimics the growing support for gay marriage -- though Americans are still less likely to accept that practice than interracial marriage. It also follows the trend toward increasing racial tolerance on other measures such as voting for a black president and an increasing belief in progress and equality for blacks in the U.S. more generally.
Survey Methods
Results for this USA Today/Gallup poll are based on telephone interviews conducted Aug. 4-7, 2011, with a random sample of 1,319 adults, aged 18 and older, living in the continental U.S., selected using random-digit-dial sampling. This includes an oversample of 376 non-Hispanic blacks, consisting of 88 interviews done as part of the random national sample and 288 interviews with blacks who had previously participated in national Gallup polls and agreed to be re-interviewed at a later date. The data from the national sample and re-interviews are combined and weighted to be demographically representative of the national adult population in the United States and to reflect the proper proportion of blacks in the overall population.
For results based on the total sample of national adults, one can say with 95% confidence that the maximum margin of sampling error is ±4 percentage points.
For results based on the sample of 376 non-Hispanic blacks, the maximum margin of sampling error is ±6 percentage points.
For results based on the sample of 796 non-Hispanic whites, the maximum margin of sampling error is ±5 percentage points.
Interviews are conducted with respondents on landline telephones and cellular phones, with interviews conducted in Spanish for respondents who are primarily Spanish-speaking. Each sample includes a minimum quota of 400 cell phone respondents and 600 landline respondents per 1,000 national adults, with additional minimum quotas among landline respondents by region. Landline telephone numbers are chosen at random among listed telephone numbers. Cell phone numbers are selected using random-digit-dial methods. Landline respondents are chosen at random within each household on the basis of which member had the most recent birthday.
Samples are weighted by gender, age, race, Hispanic ethnicity, education, region, adults in the household, and phone status (cell phone only/landline only/both, cell phone mostly, and having an unlisted landline number). Demographic weighting targets are based on the March 2010 Current Population Survey figures for the aged 18 and older non-institutionalized population living in U.S. telephone households. All reported margins of sampling error include the computed design effects for weighting and sample design.
In addition to sampling error, question wording and practical difficulties in conducting surveys can introduce error or bias into the findings of public opinion polls.
View methodology, full question results, and trend data.
For more details on Gallup's polling methodology, visit https://www.gallup.com/.
