Story Highlights
- Beer continues to edge out wine, liquor as preferred alcoholic drink
- 65% of Americans say they drink alcoholic beverages
- A quarter of drinkers say they occasionally drink too much
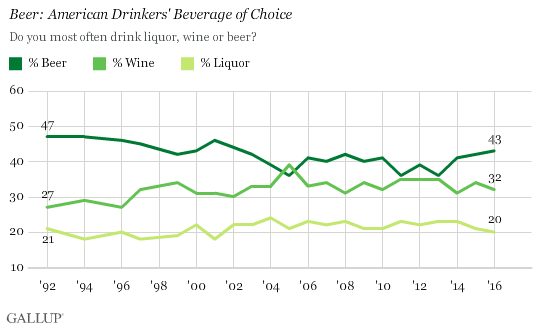
WASHINGTON, D.C. -- Beer remains the alcoholic beverage of choice among Americans who imbibe alcohol. While 43% of Americans who drink alcohol say they prefer beer, 32% say wine and 20% say liquor.

These results come from Gallup's 2016 Consumption Habits survey, conducted July 13-17. The 43% of U.S. adult drinkers who say they drink beer most often is the highest since 2002, when 44% said the same. At several points since 2005, wine and beer essentially tied as the preferred alcoholic beverage, but in the last three years beer has held firmly as the top choice.
Americans' drink of choice differs by gender, as it has since the 1990s. Half of female drinkers prefer wine, based on combined data from 2010 through 2016, while beer and liquor tie as their next-favored beverage (23%). Meanwhile, 54% of male drinkers name beer as their preferred drink, followed by liquor (22%) and wine (18%). These gender differences largely echo men's and women's alcoholic beverage preferences from the previous decade (2001-2009).
| Men, 2001-2009 | Men, 2010-2016 | Women, 2001-2009 | Women, 2010-2016 | ||||||||||||||||||||||||||||||||||||||||||||||||||||||||||||||||||||||||||||||||||||||||||||||||
|---|---|---|---|---|---|---|---|---|---|---|---|---|---|---|---|---|---|---|---|---|---|---|---|---|---|---|---|---|---|---|---|---|---|---|---|---|---|---|---|---|---|---|---|---|---|---|---|---|---|---|---|---|---|---|---|---|---|---|---|---|---|---|---|---|---|---|---|---|---|---|---|---|---|---|---|---|---|---|---|---|---|---|---|---|---|---|---|---|---|---|---|---|---|---|---|---|---|---|---|
| % | % | % | % | ||||||||||||||||||||||||||||||||||||||||||||||||||||||||||||||||||||||||||||||||||||||||||||||||
| Liquor | 19 | 22 | 25 | 23 | |||||||||||||||||||||||||||||||||||||||||||||||||||||||||||||||||||||||||||||||||||||||||||||||
| Wine | 20 | 18 | 47 | 50 | |||||||||||||||||||||||||||||||||||||||||||||||||||||||||||||||||||||||||||||||||||||||||||||||
| Beer | 57 | 54 | 24 | 23 | |||||||||||||||||||||||||||||||||||||||||||||||||||||||||||||||||||||||||||||||||||||||||||||||
| Gallup, July 13-17, 2016 | |||||||||||||||||||||||||||||||||||||||||||||||||||||||||||||||||||||||||||||||||||||||||||||||||||
Most Americans Drink, but Higher-Income More Likely
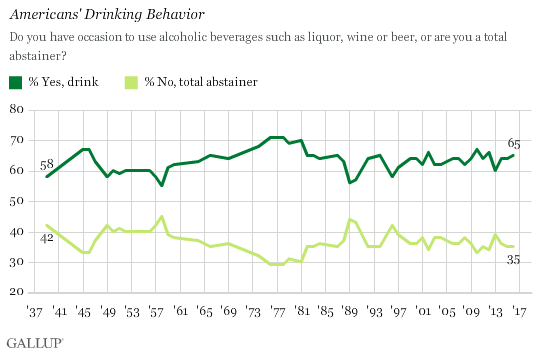
Since 1939, Gallup has consistently found that a solid majority of Americans consume alcohol; however, the precise percentage has varied between 55% and 71%. The low point came in 1958, while the high occurred in the late 1970s. This year, 65% of Americans say they imbibe and 35% say they wholly abstain.

The choice to drink alcohol varies markedly among income groups. Between 2010 and 2016, 79% of higher-income Americans said they have occasion to imbibe, compared with 63% of middle-income Americans and 49% of lower-income Americans. These differences may stem from higher-income Americans having more disposable income to spend on alcoholic beverages.
| Have occasion to drink | |||||||||||||||||||||||||||||||||||||||||||||||||||||||||||||||||||||||||||||||||||||||||||||||||||
|---|---|---|---|---|---|---|---|---|---|---|---|---|---|---|---|---|---|---|---|---|---|---|---|---|---|---|---|---|---|---|---|---|---|---|---|---|---|---|---|---|---|---|---|---|---|---|---|---|---|---|---|---|---|---|---|---|---|---|---|---|---|---|---|---|---|---|---|---|---|---|---|---|---|---|---|---|---|---|---|---|---|---|---|---|---|---|---|---|---|---|---|---|---|---|---|---|---|---|---|
| % | |||||||||||||||||||||||||||||||||||||||||||||||||||||||||||||||||||||||||||||||||||||||||||||||||||
| Less than $30,000 | 49 | ||||||||||||||||||||||||||||||||||||||||||||||||||||||||||||||||||||||||||||||||||||||||||||||||||
| $30,000 to less than $75,000 | 63 | ||||||||||||||||||||||||||||||||||||||||||||||||||||||||||||||||||||||||||||||||||||||||||||||||||
| $75,000 or more | 79 | ||||||||||||||||||||||||||||||||||||||||||||||||||||||||||||||||||||||||||||||||||||||||||||||||||
| Gallup, July 13-17, 2016 | |||||||||||||||||||||||||||||||||||||||||||||||||||||||||||||||||||||||||||||||||||||||||||||||||||
Drinking Not an Issue for Most Americans; More Problematic for Men
In the most recent poll, 25% of those who drink alcohol say they sometimes drink more than they should. Between 2010 and 2016, men (26%) were more likely than women (16%) to say they occasionally drink excessively -- a gender discrepancy largely unchanged from the previous decade.
| Occasionally drink too much | |||||||||||||||||||||||||||||||||||||||||||||||||||||||||||||||||||||||||||||||||||||||||||||||||||
|---|---|---|---|---|---|---|---|---|---|---|---|---|---|---|---|---|---|---|---|---|---|---|---|---|---|---|---|---|---|---|---|---|---|---|---|---|---|---|---|---|---|---|---|---|---|---|---|---|---|---|---|---|---|---|---|---|---|---|---|---|---|---|---|---|---|---|---|---|---|---|---|---|---|---|---|---|---|---|---|---|---|---|---|---|---|---|---|---|---|---|---|---|---|---|---|---|---|---|---|
| % | |||||||||||||||||||||||||||||||||||||||||||||||||||||||||||||||||||||||||||||||||||||||||||||||||||
| Men, 2010-2016 | 26 | ||||||||||||||||||||||||||||||||||||||||||||||||||||||||||||||||||||||||||||||||||||||||||||||||||
| Men, 2001-2009 | 28 | ||||||||||||||||||||||||||||||||||||||||||||||||||||||||||||||||||||||||||||||||||||||||||||||||||
| Women, 2010-2016 | 16 | ||||||||||||||||||||||||||||||||||||||||||||||||||||||||||||||||||||||||||||||||||||||||||||||||||
| Women, 2001-2009 | 16 | ||||||||||||||||||||||||||||||||||||||||||||||||||||||||||||||||||||||||||||||||||||||||||||||||||
| Gallup, July 13-17, 2016 | |||||||||||||||||||||||||||||||||||||||||||||||||||||||||||||||||||||||||||||||||||||||||||||||||||
Bottom Line
Drinking remains a popular pastime for most Americans. For the nearly two in three Americans who imbibe, beer is consistently the preferred beverage of choice. However, more women continue to favor wine over beer and liquor. Gender differences in drinking behavior do not stop at favored alcoholic beverage, however. Men are more likely than women to say they occasionally drink more than they should.
A study by the University of Texas at Austin last year revealed that alcohol advertisement sales have increased 400% in the past four decades. This increase in advertisement sales could, in part, reflect a lack of growth in the percentage of Americans who drink alcohol and the stability of their preferred beverage of choice. Alcohol producers must compete with an ever-increasing number of producers and a population of drinkers that, rather than expanding, has remained relatively constant for decades.
Historical data are available in Gallup Analytics.
Survey Methods
Results for this Gallup poll are based on telephone interviews conducted July 13-17, 2016, with a random sample of 1,023 adults, aged 18 and older, living in all 50 U.S. states and the District of Columbia. For results based on the total sample of national adults, the margin of sampling error is ±4 percentage points at the 95% confidence level. For results based on the total sample of 682 adults who drink alcoholic beverages, the margin of sampling error is ±5 percentage points at the 95% confidence level. All reported margins of sampling error include computed design effects for weighting.
Each sample of national adults includes a minimum quota of 60% cellphone respondents and 40% landline respondents, with additional minimum quotas by time zone within region. Landline and cellular telephone numbers are selected using random-digit-dial methods.
View complete question responses and trends.
Learn more about how the Gallup Poll Social Series works.


