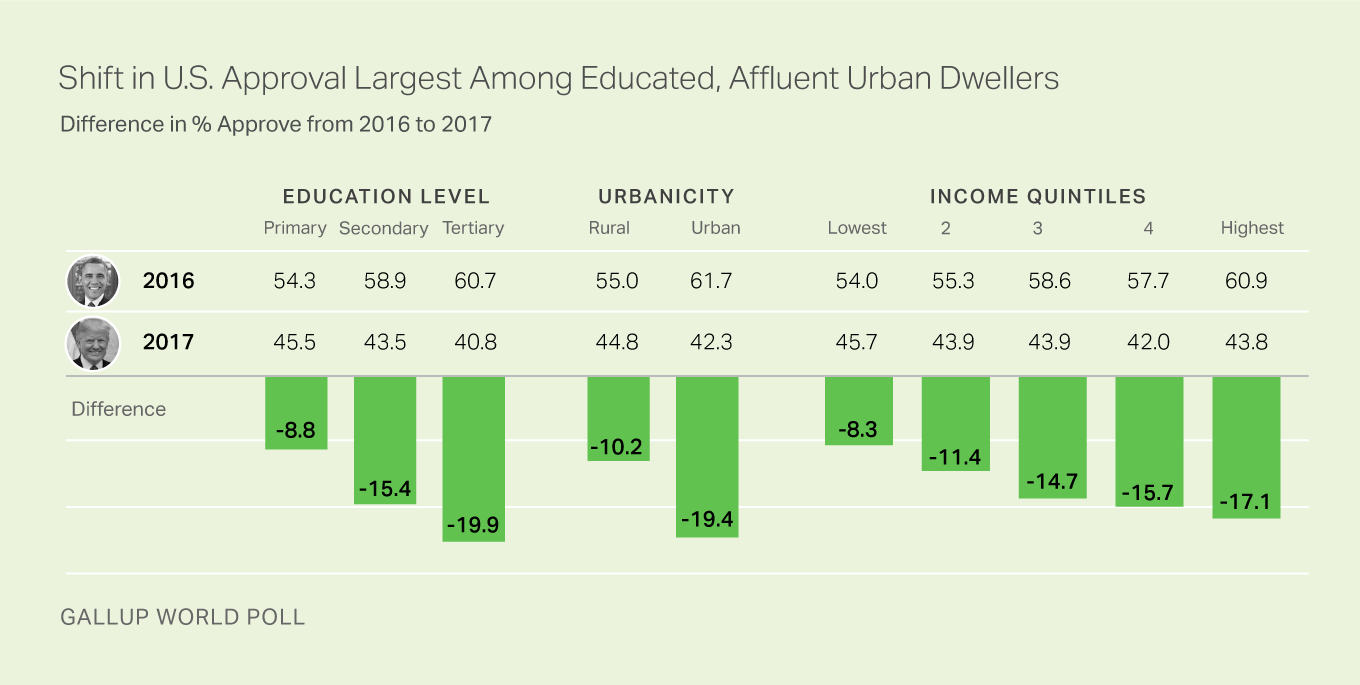
Ratings of U.S. leadership fell in nearly every part of the world in the first year of Donald Trump's presidency, dragging median approval to a record-low 30%. Curious about the true depth of a "Trump effect" on U.S. leadership ratings, we created a model to estimate the change in the probability that a similar respondent who approved of U.S. leadership in Barack Obama's last year also approved in Trump's first year. The model revealed evidence of a Trump effect in all major demographics, but the effect was more acute among some groups than others.
Shifts in U.S. Approval Largest Among Educated, Higher-Income, Urban Dwellers
Approval of U.S. leadership dropped across all demographic groups during Trump's first year, but groups that typically give U.S. leadership higher approval ratings -- those with more education, those earning higher incomes and those who live in urban areas -- registered the largest declines.

Holding other demographic variables at mean values, the probability that a respondent with a tertiary education (12 years or more of formal education) approved of U.S. leadership fell from 60.7% in 2016 to 40.8% in 2017, an absolute decline of 19.9 percentage points. Similarly, urban dwellers' approval decreased 19.4 points, and earners in the top income quintile dropped by 17.1 points.
The magnitude of the relative decline across these demographic attributes varied by region. The sharpest drop by education level occurred in Central and South America and the European Union, while approval among higher-income respondents declined most in sub-Saharan Africa and Central and South America. The greatest relative decline from rural to urban dwellers took place in East and Southeast Asia and Central and South America.
Overall, the sharper drop in approval among educated, higher-income and urban respondents is undoubtedly rooted in several causes. However, these individual-level attributes are likely related to greater awareness of international events that do not directly affect the person's daily life.
Smaller Losses by Gender, Age
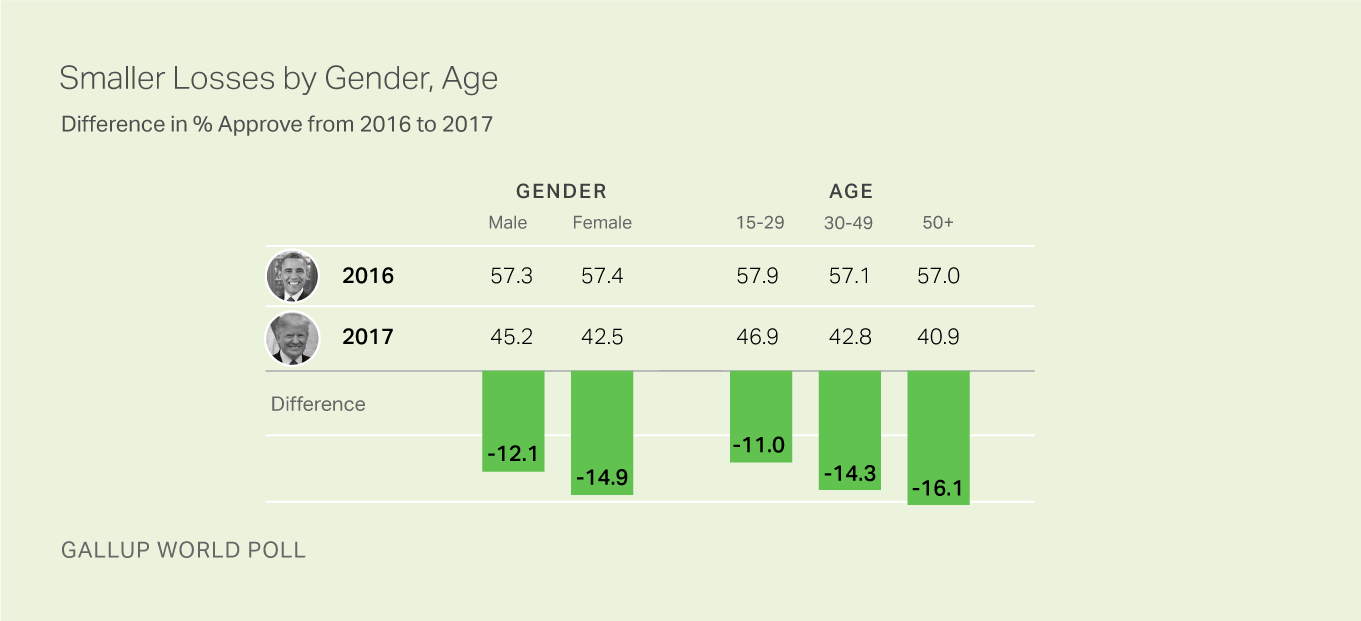
Approval of U.S. leadership fell more among women than men in 2017, a relative decline of 2.8 points from 2016 to 2017. This trend mirrors the lower approval of Trump among U.S. women. The relative drop is most prominent in East and Southeast Asia, where approval declined less for men (10.9 points) than women (18.1 points).
Approval of U.S. leadership among 15- to 29-year-olds dropped 11.0 points, but this decline was less sharp than that of 30- to 49-year-olds (14.3 points) or those aged 50 and older (16.1 points). The steepest decline among older respondents occurred in East and Southeast Asia, where approval among those aged 50 and older dropped 21.4 points.

Implications
The "America First" foreign policy agenda is a significant departure in style and substance from previous administrations. The degree to which rhetoric or policy positions are driving this sharp decline in the transition from Obama to Trump remains difficult to discern, but we can determine how much approval ratings have dropped across different demographic groups. Since Trump took office, the U.S. image has declined most sharply among higher-income, educated and urban-dwelling adults, who tend to be more politically engaged.
If this influential class maintains its negative attitude toward U.S. leadership, the U.S. may experience more difficulty translating its power into influence. If disillusionment grows, politicians may increasingly seek closer relations with U.S. strategic competitors -- such as Russia and China -- and may adopt anti-American positions to garner more support at home.
Views among these opinion-makers may also trickle down to less engaged members of society, further eroding the reservoir of goodwill the U.S. has historically enjoyed in many countries for the past decade.
Download the Rating World Leaders: 2018 report.
Gallup Global Managing Partner Jon Clifton discussed the major findings from Gallup's global survey on U.S. leadership on C-SPAN. Watch now.
Survey Methods
Results are based on face-to-face and telephone interviews with approximately 1,000 adults, aged 15 and older, in each country or area in more than 130 countries in 2016 and 2017. For results based on the total samples at the country level, the margin of sampling error ranges from ±2.0 percentage points to ±5.1 percentage points at the 95% confidence level. The margin of error reflects the influence of data weighting. In addition to sampling error, question wording and practical difficulties in conducting surveys can introduce error or bias into the findings of public opinion polls.
For complete methodology and specific survey dates, please review Gallup's Country Data Set details.
NOTE ABOUT MODEL: This analysis used a country fixed-effects logistic model that included gender, education level, urbanicity, age and income quintile.
Learn more about how the Gallup World Poll works.


