Story Highlights
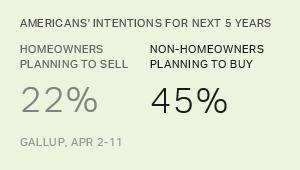
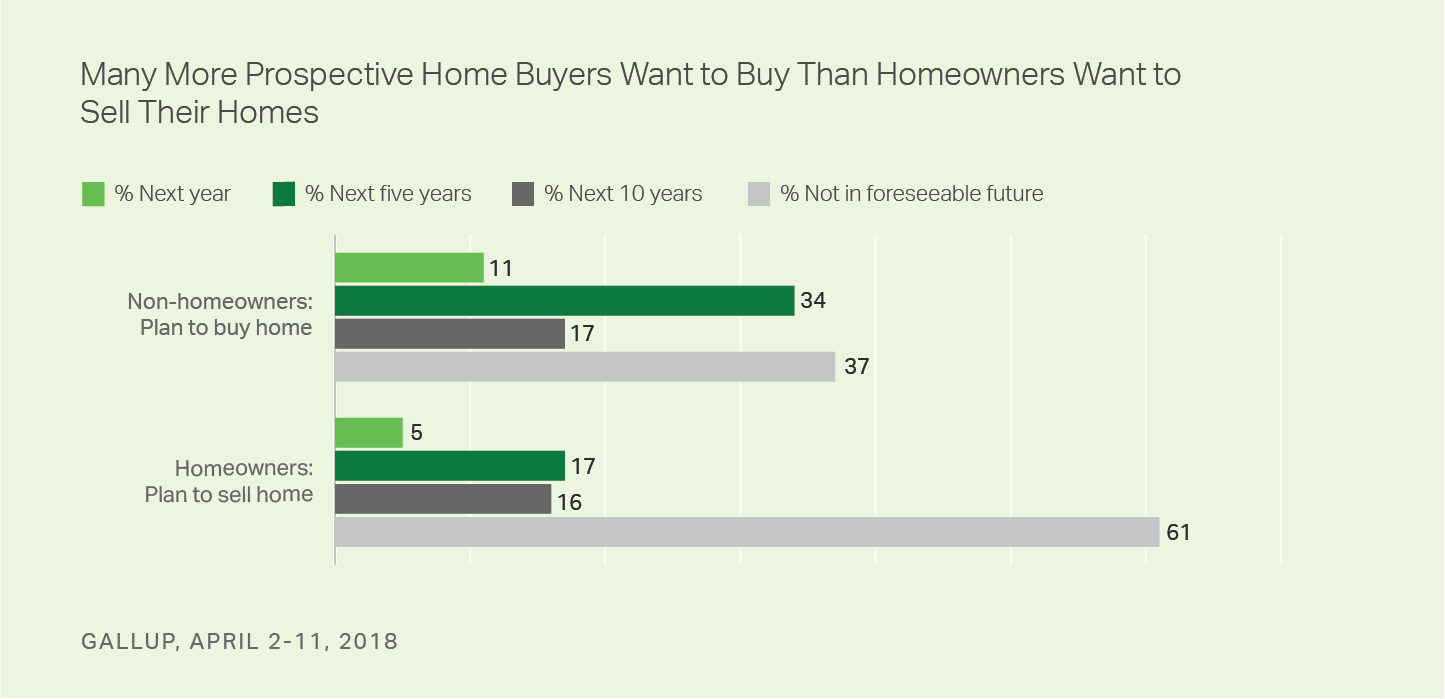
- 45% of non-homeowners plan to buy in next five years
- 22% of homeowners plan to sell
- Buying, selling intentions have been stable in recent years
WASHINGTON, D.C. -- Slightly less than half of U.S. non-homeowners, 45%, say they plan to buy a home within the next five years. But their ability to do so may be hampered by a limited supply of homes, as 22% of current homeowners plan to sell within that time frame.
These results are based on Gallup's annual Economy and Personal Finance poll, conducted April 2-11. The survey finds that 61% of U.S. adults are homeowners and 33% are renters. The remainder have another arrangement such as an adult child living with their parents.
Because there are more homeowners than non-homeowners, the percentage of prospective sellers and buyers in each group does not need to be equal for demand to be met.
Taking into account both homeownership vs. non-homeownership rates and the groups' selling and buying intentions, near-term demand still exceeds supply of existing homes for sale. Specifically, 18% of all U.S. adults do not own a home and plan to buy one in the next five years. Meanwhile, 13% of U.S. adults own a home and plan to sell in the same time frame.
That five-percentage-point gap likely understates the true supply/demand imbalance because homeowners who sell their home will in most cases be looking to purchase a different residence and will be competing with current non-homeowners to do so.
To some degree, new home construction will offset part of the imbalance between supply and demand, but the vast majority of home sales in the U.S. are of existing rather than new homes.
Prospective Housing Market Has Been Stable in Recent Years
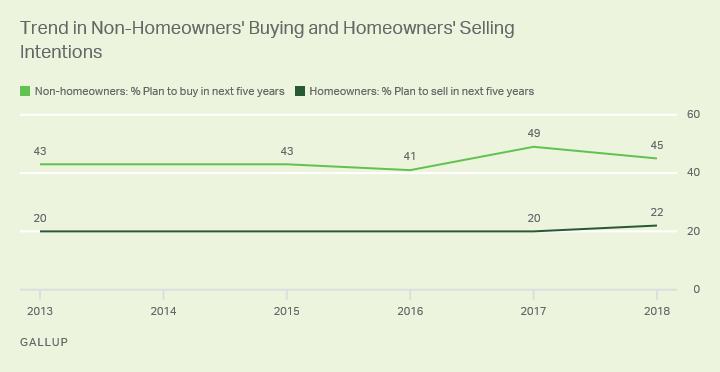
Current buying and selling intentions are similar to what Gallup has measured over the past five years, when homeownership has been steady at around 60%.
Since 2013, an average of 45% of non-homeowners interviewed across five different surveys have indicated they plan to buy a home within the next five years.
In three surveys since 2013, an average of 21% of homeowners have indicated plans to sell within five years.
Looking at combined data from 2013 through 2018, intentions to buy within the next five years are higher among specific segments of the population. Non-homeowners with children younger than 18 (64%) and those with an annual household income of $75,000 or more (61%) are among the subgroups of non-homeowners most interested in buying.
Buying intentions are roughly similar between younger and middle-aged Americans. Fifty-four percent of adults aged 18 to 34 who do not own a home plan to buy one within the next five years, as do 51% of those aged 35 to 54. Relatively few non-homeowners aged 55 and older -- 14% -- intend to buy a home in the near future.
Implications
The improving economy has put many more Americans in a position to buy homes, given low unemployment and rising wages. But homeownership rates have held steady in recent years and remain below where they were in 2001 (67%), before rapid price increases led to the housing bubble.
One reason homeownership rates have not increased is that the supply of available homes has not kept up with demand. This has led to higher home prices, which -- along with higher interest rates -- are making homes less affordable overall. Those same trends affect existing homeowners who might be looking to sell their home and move into a different one. As a result, many current homeowners who might be inclined to sell are choosing to stay put because their current home is a better value than a new one they could purchase.
Gallup's data indicate that a favorable market for sellers should continue to persist in the near future, with many more Americans looking to join the fraternity of homeowners than looking to sell.
Survey Methods
Results for this Gallup poll are based on telephone interviews conducted April 2-11, 2018, with a random sample of 1,015 adults, aged 18 and older, living in all 50 U.S. states and the District of Columbia. For results based on the total sample of national adults, the margin of sampling error is ±4 percentage points at the 95% confidence level.
For results based on the total sample of 697 homeowners, the margin of sampling error is ±5 percentage points at the 95% confidence level.
For results based on the total sample of 312 non-homeowners, the margin of sampling error is ±7 percentage points at the 95% confidence level.
All reported margins of sampling error include computed design effects for weighting.
Each sample of national adults includes a minimum quota of 70% cellphone respondents and 30% landline respondents, with additional minimum quotas by time zone within region. Landline and cellular telephone numbers are selected using random-digit-dial methods.
View survey methodology, complete question responses and trends.
Learn more about how the Gallup Poll Social Series works.