GALLUP NEWS SERVICE
PRINCETON, NJ -- Despite Federal Reserve Board Chairman Alan Greenspan's recent suggestions to Congress that the economic slowdown was less evident in January and February than it was late last year, investor optimism in February joined consumer confidence in painting a gloomy picture of the U.S. economy in early 2001.
According to the February 2001 PaineWebber/Gallup Index of Investor Optimism, investors' sentiments about the economy fell 9 points, putting the economic dimension of the Index at 15. This is the lowest score on this dimension since the Index was established in October 1996, when the economic dimension of the Index registered a rating of 41. This is also the third consecutive month that the economic dimension of the Index has been at an all-time low.
Investors' sentiments about their own personal well-being also hit an all-time low in February as the personal dimension of the Index fell to 89. This is the first time that the personal dimension of the Index has fallen below its 1996 baseline of 95.
Combined, these two dimensions of the Index convey a very negative view of investor optimism in February 2001.
Still, the overall Index of Investor Optimism declined only slightly in February, falling just 4 points to 126. An increase in investors' positive feelings about governmental policies that affect the investment climate has significantly moderated the fall of the overall Index during recent months.
In fact, investor optimism about government policies hit an all-time high in February as the governmental dimension of the Index increased to a positive rating of 22. When the Index was created in October 1996, the governmental dimension registered a negative score of -36, indicating that investors were pessimistic about government policies.
As Chairman Greenspan also noted in his late-February testimony before Congress, consumers continue to spend even though consumer confidence has plunged. In this regard, the insights provided by February's Index of Investor Optimism raise a number of questions concerning whether investors, who have strengthened consumer spending in the past, will continue to do so in the future. Will investor optimism about the government's favorable policies toward investments encourage investors to keep spending in spite of their concerns about the economy? And, if they do, does this imply that a major congressional battle over the federal budget and tax policy could have a highly negative impact on overall investor optimism and spending? In turn, does this suggest that the economy may be more vulnerable to a public-policy deadlock in 2001 than it has been at any other time in the last decade?
|
INDEX OF INVESTOR OPTIMISM October 1996 to February 2001 |
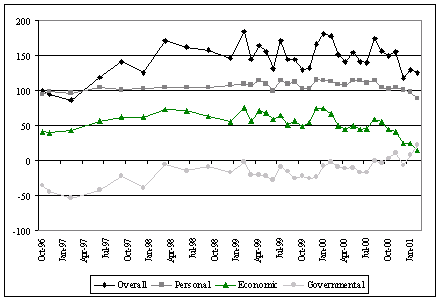
February Decline in Economic Rating Primarily Due to Investors' Concerns About Unemployment and Growth
In November 2000, the economic dimension rating was at 41 -- the same level it was at in October 1996. Since then, it declined to 24 in December and remained at 24 in January 2001. In February 2001, this rating fell another 9 points to 15. It is now at its lowest level ever.
Five questions constitute the economic dimension: optimism ratings on economic growth, unemployment, performance of the stock market, inflation and interest rates. In February, the greatest decline by far took place in net investor optimism about unemployment.
In January, investors were on balance optimistic about the unemployment situation by 12 percentage points, 44% optimistic to 32% pessimistic. In February, investors turned pessimistic about the unemployment situation with a net pessimistic rating of 9 percentage points, 33% optimistic to 42% pessimistic. It appears that all the announcements of big layoffs early this year have made investors much more pessimistic about the unemployment situation in 2001.
Investor optimism about economic growth also decreased significantly in February. In January, investors gave a net optimism rating of 15 percentage points, 44% optimistic to 29% pessimistic. By February, investor net optimism about economic growth had fallen to 8 percentage points, 40% optimistic to 32% pessimistic.
As expected, investor optimism about interest rates continued to increase in February. Although significant, this increase was not enough to offset the declines in investor optimism about unemployment and economic growth.
In December, the net optimism rating for interest rates was 23 points, 47% optimistic to 24% pessimistic (virtually identical to the November reading). But after the Fed lowered interest rates in early January, optimism increased to a net positive of 34 percentage points, 55% to 21%. By February 2001, after the Fed lowered interest rates significantly once again, investor optimism about interest rates increased another notch to a net 41 percentage points, 59% to 18%. Investors' growing optimism about interest rates may be one reason they were so susceptible to rumors -- proven untrue -- that the Fed would announce another rate cut when Chairman Greenspan testified before Congress instead of waiting until the next Federal Open Market Committee meeting on March 20.
The two other questions that comprise the economic dimension of the Index showed little change. Investor net optimism about the stock market decreased slightly, from a net positive rating of 7 percentage points in January to a net positive rating of 6 percentage points in February. Investor optimism about inflation increased from a net positive of 9 percentage points, in both December and January, to a net positive of 12 percentage points in February.
Investors More Optimistic About Government's Policies on Tax Incentives for Investing
The governmental dimension of the Index improved in February 2001, from +8 to +22 -- a 14-point increase. This follows a similar 15-point increase that took place in January.
Much of the improvement in this dimension over the past two months is found in the question asking investors to rate their optimism on the federal government's policies about tax incentives for saving or investing. In December 2000, net optimism was just a positive 2 percentage points, as 36% of investors said they were optimistic and 34% said pessimistic. In January 2001, net optimism increased to a positive 19 points, and in February it increased further to a positive 26 percentage points (51% optimistic to 25% pessimistic).
This jump in optimism could well be related to the Bush administration's tax-cut proposal that would cut personal income taxes across the board. Optimism also might be higher in March as the popularity of the tax-cut idea has increased following the president's budget address to the Congress.
On the other two questions that constitute the governmental dimension, there was also some positive movement in February 2001. One of the questions asked investors to rate their optimism on governmental policies dealing with Social Security and Medicare. In February, net optimism on this question increased from 1 percentage point to 7 percentage points.
Similarly, the third question that constitutes the governmental dimension -- investors' optimism about the federal budget -- also showed an increase in optimism, from net optimism of 4 percentage points in January to 14 percentage points in February 2001.
Survey Methods
The results reported here are based on telephone interviews with a randomly selected national sample of 1,000 adult investors, 18 years and older, with at least $10,000 of investable assets, conducted February 1-14, 2001. For results based on this sample, one can say with 95 percent confidence that the maximum error attributable to sampling and other random effects is plus or minus 3 percentage points. In addition to sampling error, question wording and practical difficulties in conducting surveys can introduce error or bias into the findings of public opinion polls.
Economic Dimension:
Now, I would like to ask you to think about the factors that could affect the overall investment environment OVER THE NEXT 12 MONTHS. On the same five-point scale, as far as the general condition of the economy is concerned, how would you rate(read and rotate A-E), OVER THE NEXT 12 MONTHS?
-
- economic growth
|
Very opti- |
Some- |
Neither opti- |
Somewhat pessi- |
Very pessi- |
Don't know/ |
|
|
% |
% |
% |
% |
% |
% |
|
|
01 Feb |
9 |
31 |
26 |
25 |
7 |
2 |
|
01 Jan |
9 |
35 |
25 |
25 |
4 |
2 |
|
00 Dec |
10 |
36 |
27 |
21 |
5 |
1 |
|
00 Nov |
12 |
47 |
21 |
16 |
2 |
2 |
|
00 Oct |
13 |
48 |
19 |
16 |
1 |
3 |
|
00 Sep |
16 |
51 |
19 |
10 |
2 |
2 |
|
00 Aug |
18 |
51 |
17 |
11 |
* |
3 |
|
00 Jul |
15 |
46 |
24 |
12 |
2 |
1 |
|
00 Jun |
15 |
51 |
19 |
11 |
2 |
2 |
|
00 May |
17 |
53 |
19 |
8 |
1 |
2 |
|
00 Apr |
16 |
51 |
18 |
13 |
1 |
1 |
|
00 Mar |
16 |
53 |
15 |
12 |
2 |
2 |
|
00 Feb |
21 |
55 |
13 |
7 |
2 |
2 |
|
00 Jan |
22 |
57 |
10 |
7 |
1 |
3 |
|
99 Dec |
24 |
50 |
12 |
10 |
2 |
2 |
|
99 Nov |
16 |
54 |
15 |
11 |
2 |
2 |
|
99 Oct |
16 |
51 |
15 |
13 |
3 |
2 |
|
99 Sep |
15 |
57 |
15 |
10 |
2 |
1 |
|
99 Aug |
16 |
51 |
17 |
11 |
3 |
2 |
|
99 Jul |
20 |
52 |
15 |
11 |
1 |
1 |
|
99 Jun |
17 |
54 |
14 |
12 |
2 |
1 |
|
99 May |
22 |
52 |
14 |
8 |
3 |
1 |
|
99 Apr |
18 |
53 |
13 |
12 |
2 |
2 |
|
99 Mar |
16 |
52 |
14 |
13 |
3 |
2 |
|
99 Feb |
20 |
51 |
13 |
13 |
2 |
1 |
|
98 Dec |
11 |
50 |
21 |
15 |
2 |
1 |
|
98 Sep |
16 |
51 |
15 |
13 |
3 |
2 |
|
98 Jun |
20 |
52 |
14 |
9 |
2 |
3 |
|
98 Mar |
17 |
53 |
16 |
10 |
3 |
1 |
|
97 Dec |
15 |
51 |
19 |
10 |
4 |
1 |
|
97 Sep |
16 |
50 |
18 |
9 |
3 |
4 |
|
97 May/Jun |
15 |
53 |
18 |
10 |
2 |
2 |
|
97 Feb/Mar |
11 |
49 |
20 |
14 |
4 |
2 |
|
96 Nov |
11 |
43 |
21 |
17 |
5 |
3 |
|
96 Oct |
10 |
43 |
24 |
16 |
4 |
3 |
|
* Less than 0.5% |
||||||
b. the unemployment rate
|
Very opti- |
Some- |
Neither opti- |
Somewhat pessi- |
Very |
Don't know/ |
|
|
% |
% |
% |
% |
% |
% |
|
|
01 Feb |
7 |
26 |
24 |
29 |
13 |
1 |
|
01 Jan |
10 |
34 |
21 |
26 |
6 |
3 |
|
00 Dec |
16 |
31 |
24 |
21 |
6 |
2 |
|
00 Nov |
15 |
41 |
24 |
12 |
5 |
3 |
|
00 Oct |
20 |
40 |
20 |
16 |
2 |
2 |
|
00 Sep |
20 |
45 |
21 |
10 |
3 |
1 |
|
00 Aug |
21 |
42 |
22 |
8 |
3 |
4 |
|
00 Jul |
20 |
41 |
19 |
13 |
3 |
4 |
|
00 Jun |
20 |
41 |
18 |
14 |
4 |
3 |
|
00 May |
25 |
41 |
18 |
10 |
3 |
3 |
|
00 Apr |
21 |
43 |
21 |
11 |
3 |
1 |
|
00 Mar |
24 |
40 |
19 |
13 |
2 |
2 |
|
00 Feb |
29 |
42 |
16 |
8 |
3 |
2 |
|
00 Jan |
28 |
46 |
13 |
7 |
4 |
2 |
|
99 Dec |
31 |
41 |
13 |
9 |
4 |
2 |
|
99 Nov |
23 |
42 |
19 |
10 |
4 |
2 |
|
99 Oct |
20 |
43 |
20 |
12 |
4 |
1 |
|
99 Sep |
23 |
47 |
16 |
10 |
2 |
2 |
|
99 Aug |
22 |
41 |
18 |
12 |
4 |
3 |
|
99 Jul |
25 |
41 |
18 |
10 |
3 |
3 |
|
99 Jun |
21 |
46 |
17 |
11 |
3 |
2 |
|
99 May |
21 |
44 |
18 |
12 |
4 |
1 |
|
99 Apr |
23 |
42 |
20 |
10 |
2 |
3 |
|
99 Mar |
20 |
43 |
15 |
15 |
6 |
1 |
|
99 Feb |
25 |
44 |
15 |
11 |
2 |
3 |
|
98 Dec |
20 |
40 |
18 |
14 |
4 |
4 |
|
98 Sep |
22 |
45 |
16 |
11 |
3 |
3 |
|
98 Jun |
26 |
39 |
16 |
11 |
4 |
4 |
|
98 Mar |
26 |
42 |
16 |
9 |
4 |
3 |
|
97 Dec |
22 |
40 |
18 |
12 |
4 |
4 |
|
97 Sep |
20 |
42 |
21 |
8 |
4 |
5 |
|
97 May/Jun |
18 |
44 |
19 |
11 |
4 |
4 |
|
97 Feb/Mar |
10 |
40 |
23 |
16 |
7 |
4 |
|
96 Nov |
11 |
37 |
23 |
16 |
8 |
5 |
|
96 Oct |
13 |
36 |
29 |
14 |
4 |
4 |
c. the performance of the stock market
|
Very opti- |
Some- |
Neither opti- |
Somewhat pessi- |
Very pessi- |
Don't know/ |
|
|
% |
% |
% |
% |
% |
% |
|
|
01 Feb |
5 |
35 |
23 |
27 |
7 |
3 |
|
01 Jan |
9 |
31 |
23 |
27 |
6 |
4 |
|
00 Dec |
9 |
33 |
26 |
23 |
6 |
3 |
|
00 Nov |
9 |
43 |
23 |
19 |
3 |
3 |
|
00 Oct |
7 |
44 |
24 |
17 |
4 |
4 |
|
00 Sep |
11 |
49 |
21 |
13 |
3 |
3 |
|
00 Aug |
15 |
43 |
21 |
15 |
2 |
4 |
|
00 Jul |
12 |
43 |
21 |
17 |
3 |
5 |
|
00 Jun |
11 |
46 |
21 |
17 |
3 |
2 |
|
00 May |
8 |
47 |
23 |
16 |
3 |
3 |
|
00 Apr |
10 |
41 |
23 |
18 |
5 |
3 |
|
00 Mar |
15 |
48 |
17 |
14 |
3 |
3 |
|
00 Feb |
15 |
51 |
18 |
12 |
2 |
2 |
|
00 Jan |
18 |
50 |
18 |
8 |
3 |
3 |
|
99 Dec |
21 |
47 |
14 |
11 |
3 |
4 |
|
99 Nov |
14 |
48 |
18 |
14 |
3 |
3 |
|
99 Oct |
11 |
46 |
18 |
16 |
6 |
3 |
|
99 Sep |
13 |
50 |
20 |
12 |
2 |
3 |
|
99 Aug |
12 |
43 |
23 |
15 |
3 |
4 |
|
99 Jul |
18 |
46 |
18 |
14 |
3 |
1 |
|
99 Jun |
17 |
45 |
17 |
15 |
3 |
3 |
|
99 May |
19 |
43 |
21 |
12 |
2 |
3 |
|
99 Apr |
17 |
47 |
17 |
13 |
2 |
4 |
|
99 Mar |
15 |
47 |
17 |
13 |
5 |
3 |
|
99 Feb |
17 |
46 |
17 |
13 |
4 |
3 |
|
98 Dec |
11 |
41 |
24 |
17 |
4 |
3 |
|
98 Sep |
13 |
41 |
20 |
18 |
5 |
3 |
|
98 Jun |
16 |
47 |
16 |
13 |
2 |
6 |
|
98 Mar |
22 |
41 |
18 |
12 |
3 |
4 |
|
97 Dec |
14 |
47 |
19 |
11 |
4 |
5 |
|
97 Sep |
20 |
39 |
20 |
11 |
3 |
7 |
|
97 May/Jun |
18 |
43 |
20 |
12 |
1 |
6 |
|
97 Feb/Mar |
17 |
39 |
20 |
12 |
4 |
8 |
|
96 Nov |
18 |
39 |
20 |
12 |
3 |
8 |
|
96 Oct |
13 |
40 |
23 |
14 |
3 |
7 |
d. inflation
|
Very opti- |
Some- |
Neither opti- |
Somewhat pessi- |
Very pessi- |
Don't know/ |
|
|
% |
% |
% |
% |
% |
% |
|
|
01 Feb |
10 |
31 |
26 |
22 |
7 |
4 |
|
01 Jan |
10 |
29 |
29 |
23 |
7 |
2 |
|
00 Dec |
9 |
32 |
25 |
26 |
6 |
2 |
|
00 Nov |
10 |
35 |
26 |
21 |
5 |
3 |
|
00 Oct |
10 |
34 |
30 |
20 |
4 |
2 |
|
00 Sep |
9 |
42 |
23 |
18 |
5 |
3 |
|
00 Aug |
11 |
41 |
23 |
17 |
3 |
5 |
|
00 Jul |
9 |
38 |
25 |
20 |
6 |
2 |
|
00 Jun |
12 |
34 |
22 |
24 |
6 |
2 |
|
00 May |
8 |
38 |
24 |
22 |
5 |
3 |
|
00 Apr |
11 |
33 |
23 |
26 |
5 |
2 |
|
00 Mar |
14 |
32 |
21 |
26 |
5 |
2 |
|
00 Feb |
12 |
42 |
22 |
18 |
4 |
2 |
|
00 Jan |
14 |
43 |
23 |
14 |
3 |
3 |
|
99 Dec |
15 |
42 |
18 |
18 |
3 |
4 |
|
99 Nov |
9 |
43 |
22 |
19 |
4 |
3 |
|
99 Oct |
9 |
41 |
22 |
21 |
6 |
1 |
|
99 Sep |
12 |
37 |
23 |
22 |
4 |
2 |
|
99 Aug |
13 |
36 |
25 |
19 |
4 |
3 |
|
99 Jul |
14 |
40 |
23 |
18 |
3 |
2 |
|
99 Jun |
12 |
38 |
22 |
23 |
4 |
1 |
|
99 May |
18 |
36 |
22 |
18 |
5 |
1 |
|
99 Apr |
21 |
36 |
25 |
14 |
2 |
2 |
|
99 Mar |
16 |
41 |
21 |
16 |
4 |
2 |
|
99 Feb |
19 |
47 |
20 |
11 |
2 |
1 |
|
98 Dec |
14 |
39 |
22 |
20 |
3 |
2 |
|
98 Sep |
18 |
40 |
20 |
16 |
3 |
3 |
|
98 Jun |
17 |
42 |
21 |
13 |
3 |
4 |
|
98 Mar |
19 |
39 |
21 |
15 |
3 |
3 |
|
97 Dec |
16 |
40 |
23 |
15 |
4 |
2 |
|
97 Sep |
14 |
40 |
21 |
15 |
6 |
4 |
|
97 May/Jun |
14 |
35 |
25 |
18 |
5 |
3 |
|
97 Feb/Mar |
12 |
35 |
24 |
18 |
7 |
4 |
|
96 Nov |
11 |
34 |
28 |
17 |
6 |
4 |
|
96 Oct |
12 |
34 |
28 |
17 |
5 |
4 |
e. interest rates
|
Very opti- |
Some- |
Neither opti- |
Somewhat pessi- |
Very pessi- |
Don't know/ |
|
|
% |
% |
% |
% |
% |
% |
|
|
01 Feb |
16 |
43 |
21 |
14 |
4 |
2 |
|
01 Jan |
18 |
37 |
21 |
18 |
3 |
3 |
|
00 Dec |
11 |
36 |
25 |
19 |
5 |
4 |
|
00 Nov |
8 |
39 |
28 |
19 |
4 |
2 |
|
00 Oct |
8 |
36 |
26 |
21 |
4 |
5 |
|
00 Sep |
9 |
39 |
26 |
18 |
5 |
3 |
|
00 Aug |
10 |
34 |
29 |
19 |
4 |
4 |
|
00 Jul |
8 |
34 |
26 |
23 |
6 |
3 |
|
00 Jun |
10 |
32 |
21 |
28 |
7 |
2 |
|
00 May |
8 |
32 |
22 |
29 |
6 |
3 |
|
00 Apr |
9 |
32 |
26 |
26 |
6 |
1 |
|
00 Mar |
10 |
30 |
23 |
32 |
4 |
1 |
|
00 Feb |
9 |
36 |
23 |
25 |
4 |
3 |
|
00 Jan |
10 |
42 |
21 |
20 |
2 |
5 |
|
99 Dec |
12 |
45 |
22 |
15 |
4 |
2 |
|
99 Nov |
6 |
41 |
23 |
22 |
4 |
4 |
|
99 Oct |
7 |
45 |
19 |
21 |
6 |
2 |
|
99 Sep |
6 |
39 |
20 |
28 |
4 |
3 |
|
99 Aug |
8 |
39 |
20 |
26 |
4 |
3 |
|
99 Jul |
11 |
40 |
22 |
19 |
5 |
3 |
|
99 Jun |
8 |
42 |
21 |
23 |
3 |
3 |
|
99 May |
14 |
44 |
20 |
18 |
2 |
2 |
|
99 Apr |
16 |
40 |
21 |
16 |
4 |
3 |
|
99 Mar |
13 |
42 |
18 |
19 |
6 |
2 |
|
99 Feb |
20 |
45 |
17 |
13 |
2 |
3 |
|
98 Dec |
20 |
45 |
17 |
12 |
4 |
2 |
|
98 Sep |
18 |
43 |
17 |
14 |
5 |
3 |
|
98 Jun |
16 |
43 |
21 |
12 |
3 |
5 |
|
98 Mar |
20 |
39 |
22 |
12 |
5 |
2 |
|
97 Dec |
15 |
42 |
21 |
15 |
5 |
2 |
|
97 Sep |
11 |
42 |
25 |
13 |
4 |
5 |
|
97 May/Jun |
8 |
39 |
25 |
20 |
5 |
3 |
|
97 Feb/Mar |
9 |
40 |
24 |
16 |
5 |
6 |
|
96 Nov |
11 |
38 |
24 |
17 |
5 |
5 |
|
96 Oct |
9 |
37 |
26 |
18 |
5 |
5 |
Governmental Dimension:
Now, I would like you to think about how the federal government's policies may affect the overall investment environment OVER THE NEXT 12 MONTHS. How would you rate the federal government's policies dealing with(read and rotate A-C), OVER THE NEXT 12 MONTHS?
-
- tax incentives for saving/investing
|
Very opti- |
Some- |
Neither opti- |
Somewhat pessi- |
Very pessi- |
Don't know/ |
|
|
% |
% |
% |
% |
% |
% |
|
|
01 Feb |
15 |
36 |
20 |
17 |
8 |
4 |
|
01 Jan |
12 |
36 |
20 |
19 |
10 |
3 |
|
00 Dec |
8 |
28 |
25 |
24 |
10 |
5 |
|
00 Nov |
7 |
36 |
26 |
20 |
7 |
4 |
|
00 Oct |
7 |
32 |
24 |
24 |
9 |
4 |
|
00 Sep |
8 |
28 |
26 |
24 |
11 |
3 |
|
00 Aug |
6 |
31 |
27 |
20 |
9 |
7 |
|
00 Jul |
8 |
26 |
24 |
28 |
10 |
4 |
|
00 Jun |
5 |
29 |
24 |
27 |
12 |
3 |
|
00 May |
5 |
32 |
23 |
25 |
11 |
4 |
|
00 Apr |
6 |
33 |
24 |
26 |
10 |
1 |
|
00 Mar |
7 |
29 |
24 |
27 |
11 |
2 |
|
00 Feb |
7 |
33 |
22 |
27 |
8 |
3 |
|
00 Jan |
6 |
34 |
23 |
24 |
10 |
3 |
|
99 Dec |
6 |
31 |
20 |
24 |
14 |
5 |
|
99 Nov |
5 |
29 |
25 |
26 |
12 |
3 |
|
99 Oct |
5 |
32 |
22 |
29 |
10 |
2 |
|
99 Sep |
5 |
27 |
24 |
28 |
13 |
3 |
|
99 Aug |
7 |
30 |
23 |
25 |
12 |
3 |
|
99 Jul |
8 |
33 |
19 |
27 |
11 |
2 |
|
99 Jun |
5 |
31 |
21 |
26 |
15 |
2 |
|
99 May |
7 |
28 |
25 |
28 |
11 |
1 |
|
99 Apr |
5 |
27 |
25 |
25 |
14 |
4 |
|
99 Mar |
7 |
27 |
21 |
26 |
15 |
4 |
|
99 Feb |
9 |
31 |
22 |
23 |
11 |
4 |
|
98 Dec |
6 |
29 |
24 |
25 |
13 |
3 |
|
98 Sep |
8 |
33 |
21 |
27 |
7 |
4 |
|
98 Jun |
8 |
29 |
23 |
22 |
11 |
7 |
|
98 Mar |
9 |
33 |
21 |
24 |
10 |
3 |
|
97 Dec |
6 |
29 |
22 |
25 |
15 |
3 |
|
97 Sep |
8 |
31 |
21 |
23 |
12 |
5 |
|
97 May/Jun |
6 |
25 |
22 |
30 |
14 |
3 |
|
97 Feb/Mar |
5 |
24 |
21 |
29 |
16 |
5 |
|
96 Nov |
5 |
23 |
24 |
28 |
15 |
5 |
|
96 Oct |
5 |
25 |
25 |
27 |
14 |
4 |
b. the federal budget
|
Very opti- |
Some- |
Neither opti- |
Somewhat pessi- |
Very pessi- |
Don't know/ |
|
|
% |
% |
% |
% |
% |
% |
|
|
01 Feb |
12 |
33 |
19 |
21 |
10 |
5 |
|
01 Jan |
10 |
29 |
22 |
23 |
12 |
4 |
|
00 Dec |
10 |
24 |
26 |
25 |
10 |
5 |
|
00 Nov |
6 |
36 |
24 |
21 |
7 |
6 |
|
00 Oct |
8 |
29 |
25 |
23 |
9 |
6 |
|
00 Sep |
8 |
31 |
25 |
23 |
10 |
3 |
|
00 Aug |
8 |
33 |
23 |
17 |
12 |
7 |
|
00 Jul |
9 |
26 |
24 |
24 |
13 |
4 |
|
00 Jun |
7 |
26 |
23 |
29 |
12 |
3 |
|
00 May |
6 |
34 |
22 |
25 |
10 |
3 |
|
00 Apr |
6 |
27 |
25 |
26 |
14 |
2 |
|
00 Mar |
8 |
28 |
23 |
28 |
10 |
3 |
|
00 Feb |
8 |
32 |
22 |
23 |
12 |
3 |
|
00 Jan |
10 |
31 |
20 |
25 |
12 |
2 |
|
99 Dec |
8 |
28 |
18 |
26 |
16 |
4 |
|
99 Nov |
6 |
26 |
21 |
29 |
14 |
4 |
|
99 Oct |
5 |
28 |
22 |
31 |
13 |
1 |
|
99 Sep |
6 |
28 |
23 |
28 |
13 |
2 |
|
99 Aug |
8 |
28 |
24 |
22 |
15 |
3 |
|
99 Jul |
11 |
32 |
20 |
23 |
13 |
1 |
|
99 Jun |
8 |
27 |
19 |
30 |
14 |
2 |
|
99 May |
6 |
30 |
21 |
28 |
14 |
1 |
|
99 Apr |
9 |
27 |
25 |
24 |
13 |
2 |
|
99 Mar |
8 |
33 |
18 |
24 |
14 |
3 |
|
99 Feb |
14 |
33 |
19 |
20 |
12 |
2 |
|
98 Dec |
8 |
33 |
19 |
24 |
14 |
2 |
|
98 Sep |
9 |
31 |
18 |
27 |
11 |
4 |
|
98 Jun |
11 |
30 |
17 |
23 |
14 |
5 |
|
98 Mar |
14 |
32 |
18 |
23 |
11 |
2 |
|
97 Dec |
5 |
23 |
19 |
31 |
20 |
2 |
|
97 Sep |
7 |
27 |
20 |
27 |
16 |
3 |
|
97 May/Jun |
3 |
20 |
16 |
31 |
28 |
2 |
|
97 Feb/Mar |
3 |
20 |
16 |
31 |
28 |
2 |
|
96 Nov |
5 |
21 |
18 |
31 |
23 |
2 |
|
96 Oct |
4 |
22 |
19 |
28 |
22 |
5 |
c. Social Security and Medicare
|
Very opti- |
Some- |
Neither opti- |
Somewhat pessi- |
Very pessi- |
Don't know/ |
|
|
% |
% |
% |
% |
% |
% |
|
|
01 Feb |
14 |
28 |
22 |
23 |
12 |
1 |
|
01 Jan |
11 |
27 |
23 |
25 |
12 |
2 |
|
00 Dec |
8 |
24 |
24 |
26 |
14 |
4 |
|
00 Nov |
8 |
29 |
26 |
21 |
13 |
3 |
|
00 Oct |
9 |
30 |
23 |
23 |
12 |
3 |
|
00 Sep |
10 |
26 |
22 |
26 |
14 |
2 |
|
00 Aug |
7 |
25 |
24 |
26 |
14 |
4 |
|
00 Jul |
7 |
21 |
21 |
31 |
17 |
3 |
|
00 Jun |
7 |
25 |
21 |
30 |
16 |
1 |
|
00 May |
7 |
25 |
20 |
32 |
14 |
2 |
|
00 Apr |
8 |
27 |
22 |
26 |
16 |
1 |
|
00 Mar |
10 |
23 |
22 |
28 |
15 |
2 |
|
00 Feb |
8 |
29 |
20 |
27 |
15 |
1 |
|
00 Jan |
7 |
25 |
19 |
30 |
17 |
2 |
|
99 Dec |
7 |
22 |
16 |
33 |
20 |
2 |
|
99 Nov |
5 |
21 |
20 |
31 |
21 |
2 |
|
99 Oct |
7 |
24 |
17 |
32 |
19 |
1 |
|
99 Sep |
6 |
22 |
21 |
30 |
20 |
1 |
|
99 Aug |
7 |
22 |
21 |
30 |
18 |
2 |
|
99 Jul |
8 |
24 |
17 |
32 |
18 |
1 |
|
99 Jun |
7 |
20 |
16 |
32 |
23 |
2 |
|
99 May |
5 |
22 |
21 |
31 |
20 |
1 |
|
99 Apr |
7 |
21 |
19 |
34 |
19 |
- |
|
99 Mar |
6 |
24 |
17 |
29 |
22 |
2 |
|
99 Feb |
10 |
21 |
18 |
29 |
20 |
2 |
|
98 Dec |
6 |
22 |
19 |
32 |
19 |
2 |
|
98 Sep |
7 |
21 |
17 |
32 |
19 |
4 |
|
98 Jun |
7 |
20 |
17 |
29 |
23 |
4 |
|
98 Mar |
6 |
22 |
18 |
34 |
19 |
1 |
|
97 Dec |
5 |
18 |
16 |
33 |
25 |
3 |
|
97 Sep |
7 |
18 |
21 |
29 |
23 |
2 |
|
97 May/Jun |
6 |
17 |
19 |
31 |
24 |
3 |
|
97 Feb/Mar |
5 |
16 |
17 |
32 |
26 |
4 |
|
96 Nov |
5 |
20 |
19 |
30 |
24 |
2 |
|
96 Oct |
5 |
22 |
18 |
30 |
20 |
5 |